Immigrants from the Azores vs Sudanese Unemployment Among Ages 45 to 54 years
COMPARE
Immigrants from the Azores
Sudanese
Unemployment Among Ages 45 to 54 years
Unemployment Among Ages 45 to 54 years Comparison
Immigrants from the Azores
Sudanese
5.7%
UNEMPLOYMENT AMONG AGES 45 TO 54 YEARS
0.0/ 100
METRIC RATING
322nd/ 347
METRIC RANK
4.3%
UNEMPLOYMENT AMONG AGES 45 TO 54 YEARS
97.0/ 100
METRIC RATING
87th/ 347
METRIC RANK
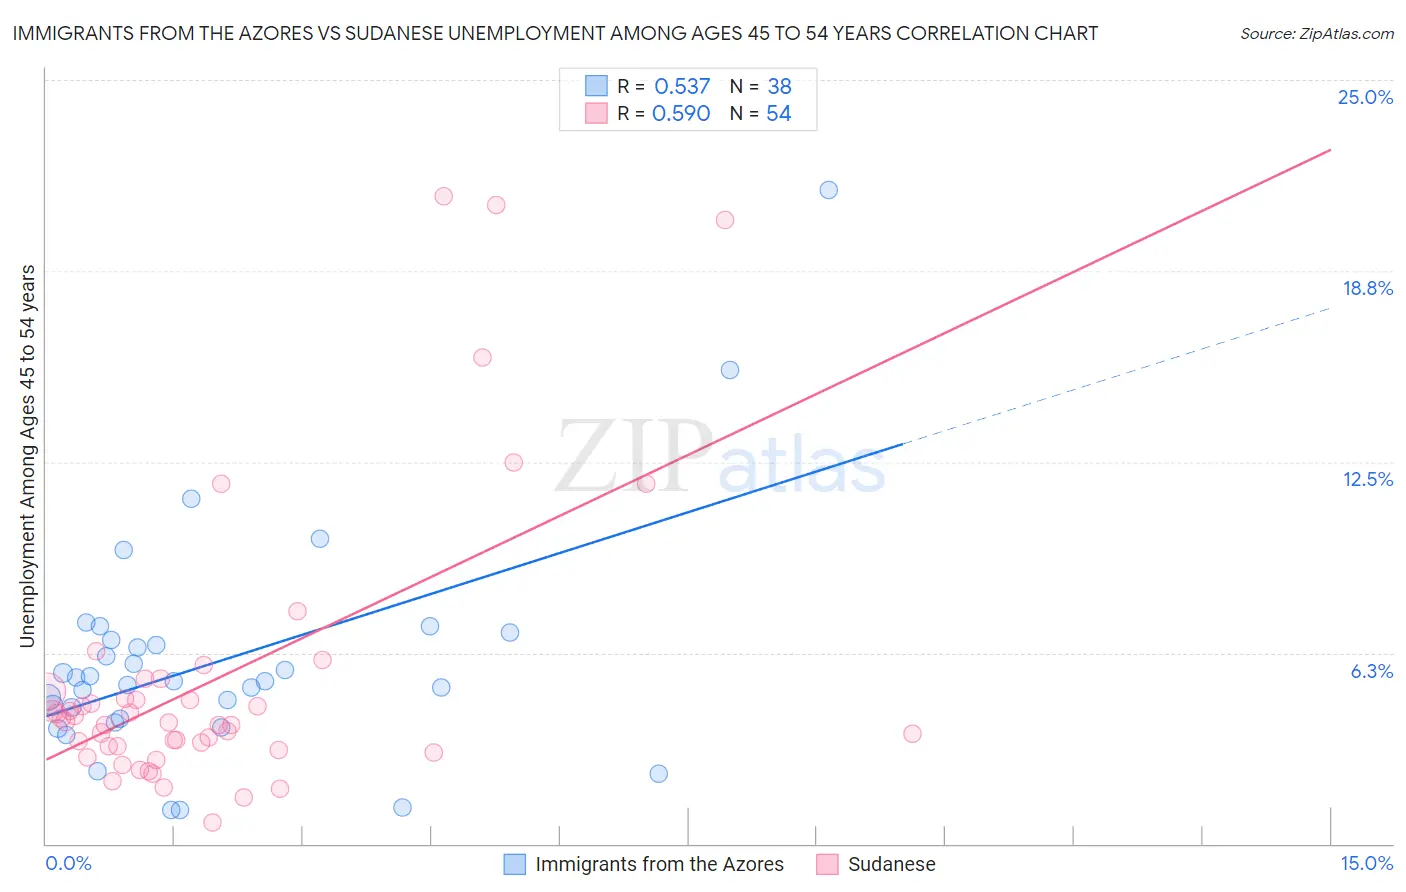
Immigrants from the Azores vs Sudanese Unemployment Among Ages 45 to 54 years Correlation Chart
The statistical analysis conducted on geographies consisting of 45,879,179 people shows a substantial positive correlation between the proportion of Immigrants from the Azores and unemployment rate among population between the ages 45 and 54 in the United States with a correlation coefficient (R) of 0.537 and weighted average of 5.7%. Similarly, the statistical analysis conducted on geographies consisting of 109,181,196 people shows a substantial positive correlation between the proportion of Sudanese and unemployment rate among population between the ages 45 and 54 in the United States with a correlation coefficient (R) of 0.590 and weighted average of 4.3%, a difference of 32.5%.
Unemployment Among Ages 45 to 54 years Correlation Summary
| Measurement | Immigrants from the Azores | Sudanese |
| Minimum | 1.1% | 0.70% |
| Maximum | 21.4% | 21.2% |
| Range | 20.3% | 20.5% |
| Mean | 6.0% | 5.4% |
| Median | 5.3% | 4.0% |
| Interquartile 25% (IQ1) | 4.1% | 3.2% |
| Interquartile 75% (IQ3) | 6.7% | 5.0% |
| Interquartile Range (IQR) | 2.6% | 1.8% |
| Standard Deviation (Sample) | 3.8% | 4.7% |
| Standard Deviation (Population) | 3.7% | 4.6% |
Similar Demographics by Unemployment Among Ages 45 to 54 years
Demographics Similar to Immigrants from the Azores by Unemployment Among Ages 45 to 54 years
In terms of unemployment among ages 45 to 54 years, the demographic groups most similar to Immigrants from the Azores are Yakama (5.7%, a difference of 0.51%), Immigrants from St. Vincent and the Grenadines (5.7%, a difference of 0.86%), Cape Verdean (5.7%, a difference of 0.87%), British West Indian (5.7%, a difference of 1.4%), and Houma (5.6%, a difference of 2.1%).
| Demographics | Rating | Rank | Unemployment Among Ages 45 to 54 years |
| Immigrants | Dominica | 0.0 /100 | #315 | Tragic 5.6% |
| Immigrants | Guyana | 0.0 /100 | #316 | Tragic 5.6% |
| Houma | 0.0 /100 | #317 | Tragic 5.6% |
| British West Indians | 0.0 /100 | #318 | Tragic 5.7% |
| Cape Verdeans | 0.0 /100 | #319 | Tragic 5.7% |
| Immigrants | St. Vincent and the Grenadines | 0.0 /100 | #320 | Tragic 5.7% |
| Yakama | 0.0 /100 | #321 | Tragic 5.7% |
| Immigrants | Azores | 0.0 /100 | #322 | Tragic 5.7% |
| Immigrants | Cabo Verde | 0.0 /100 | #323 | Tragic 5.9% |
| Natives/Alaskans | 0.0 /100 | #324 | Tragic 6.1% |
| Immigrants | Armenia | 0.0 /100 | #325 | Tragic 6.1% |
| Ute | 0.0 /100 | #326 | Tragic 6.2% |
| Dominicans | 0.0 /100 | #327 | Tragic 6.2% |
| Pueblo | 0.0 /100 | #328 | Tragic 6.2% |
| Alaska Natives | 0.0 /100 | #329 | Tragic 6.3% |
Demographics Similar to Sudanese by Unemployment Among Ages 45 to 54 years
In terms of unemployment among ages 45 to 54 years, the demographic groups most similar to Sudanese are Immigrants from Turkey (4.3%, a difference of 0.030%), Immigrants from Argentina (4.3%, a difference of 0.040%), Asian (4.3%, a difference of 0.090%), Ethiopian (4.3%, a difference of 0.10%), and Italian (4.3%, a difference of 0.14%).
| Demographics | Rating | Rank | Unemployment Among Ages 45 to 54 years |
| Cambodians | 97.8 /100 | #80 | Exceptional 4.3% |
| Immigrants | Micronesia | 97.6 /100 | #81 | Exceptional 4.3% |
| Eastern Europeans | 97.6 /100 | #82 | Exceptional 4.3% |
| Australians | 97.4 /100 | #83 | Exceptional 4.3% |
| Italians | 97.3 /100 | #84 | Exceptional 4.3% |
| French | 97.3 /100 | #85 | Exceptional 4.3% |
| Ethiopians | 97.2 /100 | #86 | Exceptional 4.3% |
| Sudanese | 97.0 /100 | #87 | Exceptional 4.3% |
| Immigrants | Turkey | 96.9 /100 | #88 | Exceptional 4.3% |
| Immigrants | Argentina | 96.9 /100 | #89 | Exceptional 4.3% |
| Asians | 96.8 /100 | #90 | Exceptional 4.3% |
| Ukrainians | 96.6 /100 | #91 | Exceptional 4.3% |
| Mongolians | 96.6 /100 | #92 | Exceptional 4.3% |
| Argentineans | 96.5 /100 | #93 | Exceptional 4.3% |
| Immigrants | Malaysia | 96.2 /100 | #94 | Exceptional 4.4% |