Immigrants from the Azores vs Immigrants from Nicaragua Householder Income Under 25 years
COMPARE
Immigrants from the Azores
Immigrants from Nicaragua
Householder Income Under 25 years
Householder Income Under 25 years Comparison
Immigrants from the Azores
Immigrants from Nicaragua
$52,621
HOUSEHOLDER INCOME UNDER 25 YEARS
74.2/ 100
METRIC RATING
154th/ 347
METRIC RANK
$53,266
HOUSEHOLDER INCOME UNDER 25 YEARS
93.3/ 100
METRIC RATING
131st/ 347
METRIC RANK
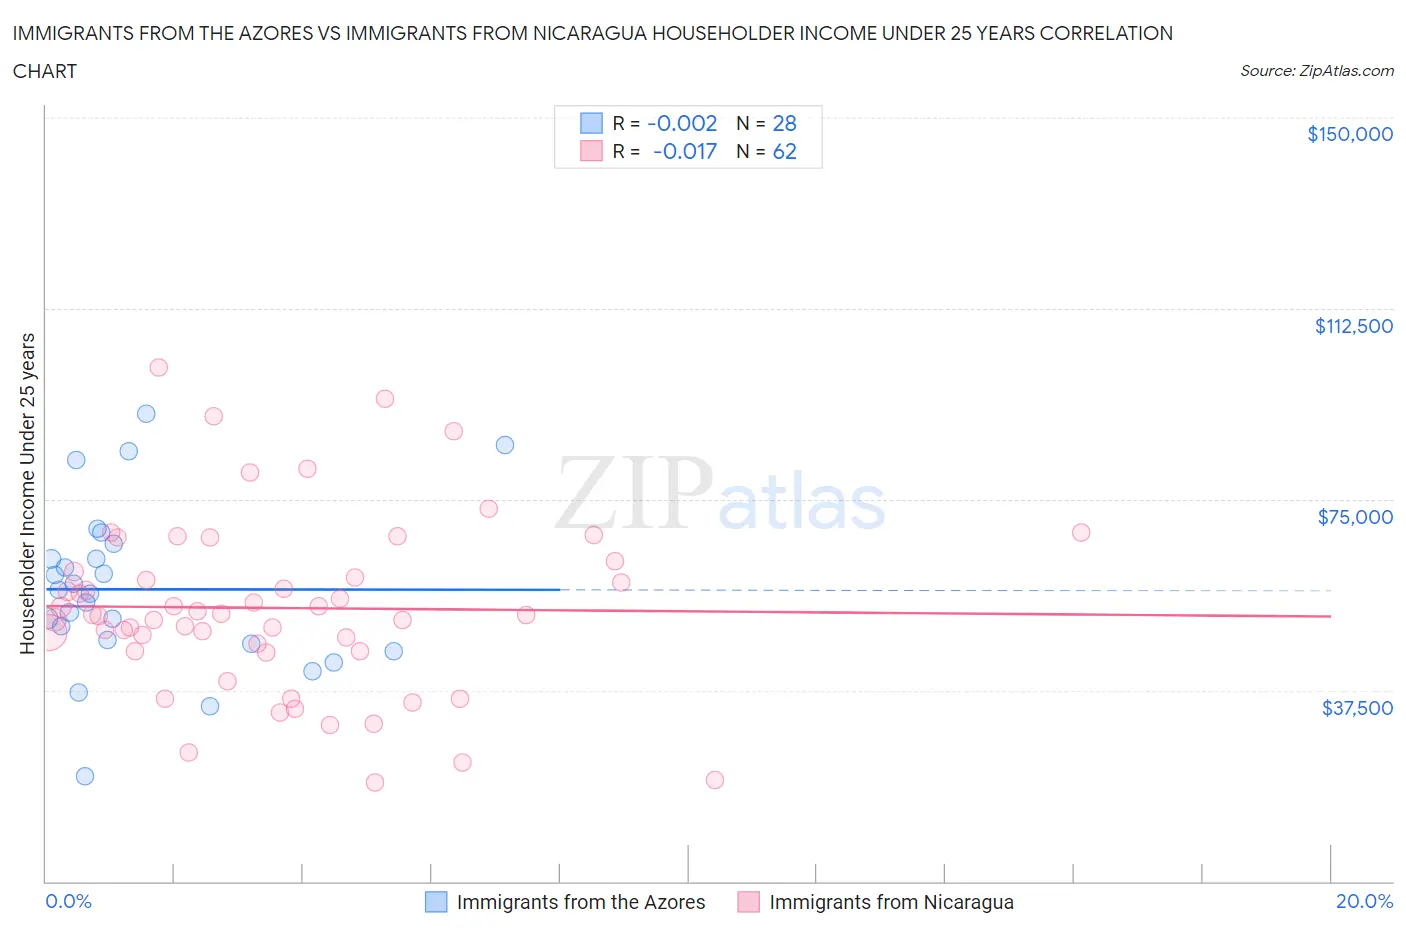
Immigrants from the Azores vs Immigrants from Nicaragua Householder Income Under 25 years Correlation Chart
The statistical analysis conducted on geographies consisting of 40,962,746 people shows no correlation between the proportion of Immigrants from the Azores and household income with householder under the age of 25 in the United States with a correlation coefficient (R) of -0.002 and weighted average of $52,621. Similarly, the statistical analysis conducted on geographies consisting of 209,989,839 people shows no correlation between the proportion of Immigrants from Nicaragua and household income with householder under the age of 25 in the United States with a correlation coefficient (R) of -0.017 and weighted average of $53,266, a difference of 1.2%.
Householder Income Under 25 years Correlation Summary
| Measurement | Immigrants from the Azores | Immigrants from Nicaragua |
| Minimum | $20,652 | $19,455 |
| Maximum | $91,938 | $100,948 |
| Range | $71,286 | $81,493 |
| Mean | $57,341 | $53,656 |
| Median | $56,819 | $52,382 |
| Interquartile 25% (IQ1) | $46,997 | $45,288 |
| Interquartile 75% (IQ3) | $64,729 | $60,822 |
| Interquartile Range (IQR) | $17,732 | $15,534 |
| Standard Deviation (Sample) | $16,204 | $17,142 |
| Standard Deviation (Population) | $15,912 | $17,003 |
Similar Demographics by Householder Income Under 25 years
Demographics Similar to Immigrants from the Azores by Householder Income Under 25 years
In terms of householder income under 25 years, the demographic groups most similar to Immigrants from the Azores are Central American ($52,626, a difference of 0.010%), Trinidadian and Tobagonian ($52,631, a difference of 0.020%), Immigrants from Denmark ($52,612, a difference of 0.020%), Immigrants from Nepal ($52,611, a difference of 0.020%), and Immigrants from Scotland ($52,638, a difference of 0.030%).
| Demographics | Rating | Rank | Householder Income Under 25 years |
| Latvians | 81.0 /100 | #147 | Excellent $52,783 |
| French Canadians | 76.5 /100 | #148 | Good $52,672 |
| Scandinavians | 75.7 /100 | #149 | Good $52,654 |
| Immigrants | Costa Rica | 75.2 /100 | #150 | Good $52,643 |
| Immigrants | Scotland | 75.0 /100 | #151 | Good $52,638 |
| Trinidadians and Tobagonians | 74.6 /100 | #152 | Good $52,631 |
| Central Americans | 74.4 /100 | #153 | Good $52,626 |
| Immigrants | Azores | 74.2 /100 | #154 | Good $52,621 |
| Immigrants | Denmark | 73.8 /100 | #155 | Good $52,612 |
| Immigrants | Nepal | 73.7 /100 | #156 | Good $52,611 |
| Ghanaians | 72.9 /100 | #157 | Good $52,594 |
| Immigrants | Netherlands | 72.8 /100 | #158 | Good $52,592 |
| Mongolians | 70.2 /100 | #159 | Good $52,540 |
| Immigrants | Turkey | 68.3 /100 | #160 | Good $52,503 |
| Uruguayans | 66.2 /100 | #161 | Good $52,465 |
Demographics Similar to Immigrants from Nicaragua by Householder Income Under 25 years
In terms of householder income under 25 years, the demographic groups most similar to Immigrants from Nicaragua are Nicaraguan ($53,275, a difference of 0.020%), Moroccan ($53,256, a difference of 0.020%), New Zealander ($53,294, a difference of 0.050%), Immigrants from Bulgaria ($53,305, a difference of 0.070%), and Immigrants from North America ($53,307, a difference of 0.080%).
| Demographics | Rating | Rank | Householder Income Under 25 years |
| Colombians | 94.6 /100 | #124 | Exceptional $53,357 |
| Pakistanis | 94.1 /100 | #125 | Exceptional $53,325 |
| Immigrants | Serbia | 94.1 /100 | #126 | Exceptional $53,321 |
| Immigrants | North America | 93.9 /100 | #127 | Exceptional $53,307 |
| Immigrants | Bulgaria | 93.9 /100 | #128 | Exceptional $53,305 |
| New Zealanders | 93.7 /100 | #129 | Exceptional $53,294 |
| Nicaraguans | 93.4 /100 | #130 | Exceptional $53,275 |
| Immigrants | Nicaragua | 93.3 /100 | #131 | Exceptional $53,266 |
| Moroccans | 93.1 /100 | #132 | Exceptional $53,256 |
| Immigrants | Immigrants | 92.2 /100 | #133 | Exceptional $53,201 |
| Immigrants | Northern Africa | 91.9 /100 | #134 | Exceptional $53,185 |
| Chileans | 91.9 /100 | #135 | Exceptional $53,185 |
| Armenians | 91.8 /100 | #136 | Exceptional $53,179 |
| Immigrants | Barbados | 91.5 /100 | #137 | Exceptional $53,163 |
| Norwegians | 90.8 /100 | #138 | Exceptional $53,127 |