Immigrants from the Azores vs Hopi In Labor Force | Age 25-29
COMPARE
Immigrants from the Azores
Hopi
In Labor Force | Age 25-29
In Labor Force | Age 25-29 Comparison
Immigrants from the Azores
Hopi
83.1%
IN LABOR FORCE | AGE 25-29
0.0/ 100
METRIC RATING
283rd/ 347
METRIC RANK
76.5%
IN LABOR FORCE | AGE 25-29
0.0/ 100
METRIC RATING
344th/ 347
METRIC RANK
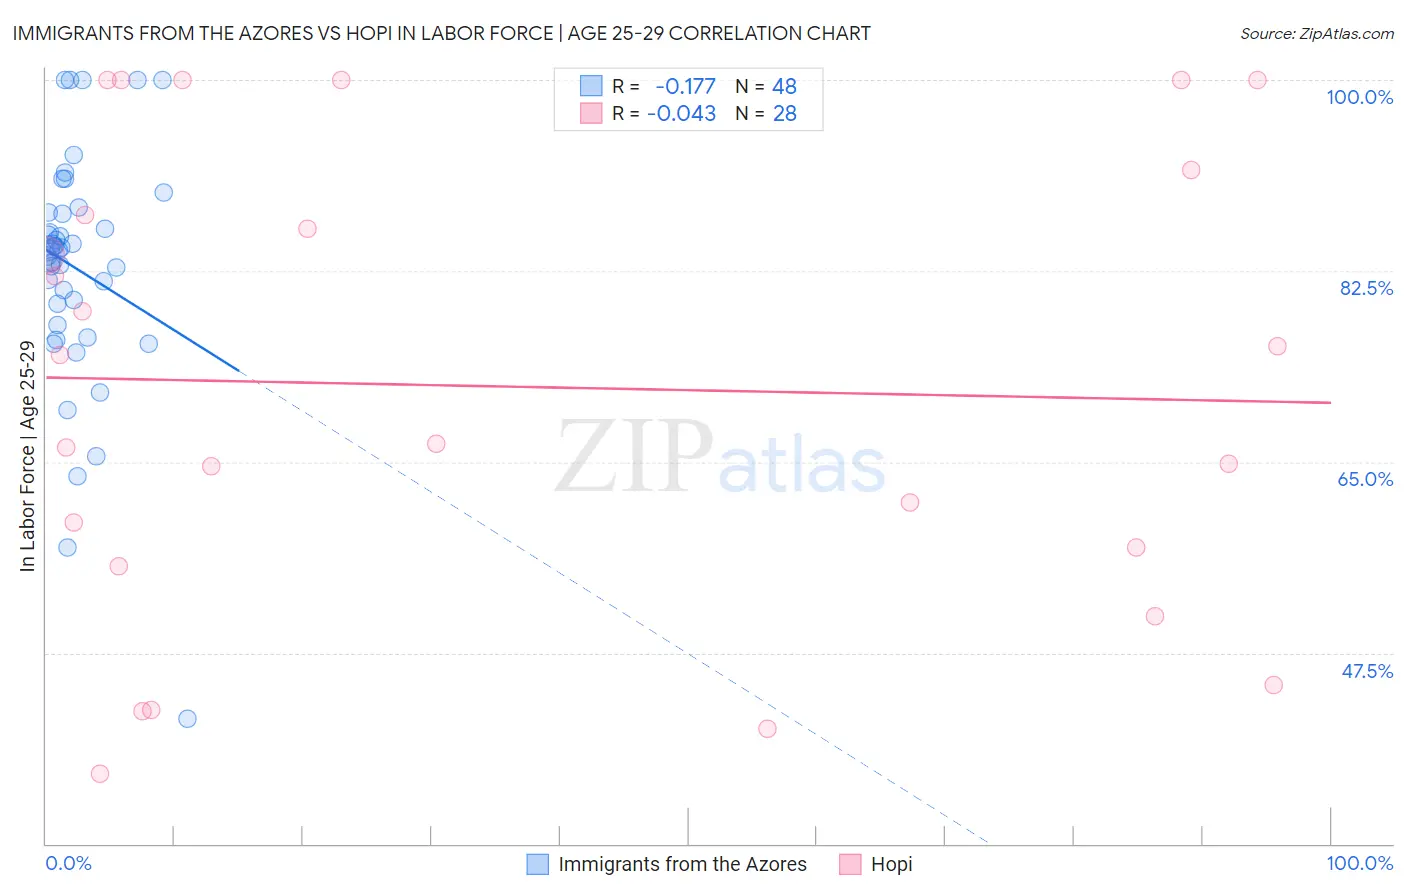
Immigrants from the Azores vs Hopi In Labor Force | Age 25-29 Correlation Chart
The statistical analysis conducted on geographies consisting of 46,246,668 people shows a poor negative correlation between the proportion of Immigrants from the Azores and labor force participation rate among population between the ages 25 and 29 in the United States with a correlation coefficient (R) of -0.177 and weighted average of 83.1%. Similarly, the statistical analysis conducted on geographies consisting of 74,722,734 people shows no correlation between the proportion of Hopi and labor force participation rate among population between the ages 25 and 29 in the United States with a correlation coefficient (R) of -0.043 and weighted average of 76.5%, a difference of 8.6%.
In Labor Force | Age 25-29 Correlation Summary
| Measurement | Immigrants from the Azores | Hopi |
| Minimum | 41.4% | 36.4% |
| Maximum | 100.0% | 100.0% |
| Range | 58.6% | 63.6% |
| Mean | 82.7% | 71.9% |
| Median | 84.5% | 70.8% |
| Interquartile 25% (IQ1) | 78.5% | 56.3% |
| Interquartile 75% (IQ3) | 87.8% | 89.7% |
| Interquartile Range (IQR) | 9.3% | 33.4% |
| Standard Deviation (Sample) | 10.9% | 21.1% |
| Standard Deviation (Population) | 10.8% | 20.7% |
Similar Demographics by In Labor Force | Age 25-29
Demographics Similar to Immigrants from the Azores by In Labor Force | Age 25-29
In terms of in labor force | age 25-29, the demographic groups most similar to Immigrants from the Azores are American (83.1%, a difference of 0.0%), Immigrants from Dominican Republic (83.1%, a difference of 0.010%), Nicaraguan (83.1%, a difference of 0.020%), Belizean (83.1%, a difference of 0.060%), and Dominican (83.2%, a difference of 0.070%).
| Demographics | Rating | Rank | In Labor Force | Age 25-29 |
| Immigrants | Honduras | 0.0 /100 | #276 | Tragic 83.3% |
| Africans | 0.0 /100 | #277 | Tragic 83.2% |
| Immigrants | Cuba | 0.0 /100 | #278 | Tragic 83.2% |
| British West Indians | 0.0 /100 | #279 | Tragic 83.2% |
| Dominicans | 0.0 /100 | #280 | Tragic 83.2% |
| Immigrants | Dominican Republic | 0.0 /100 | #281 | Tragic 83.1% |
| Americans | 0.0 /100 | #282 | Tragic 83.1% |
| Immigrants | Azores | 0.0 /100 | #283 | Tragic 83.1% |
| Nicaraguans | 0.0 /100 | #284 | Tragic 83.1% |
| Belizeans | 0.0 /100 | #285 | Tragic 83.1% |
| Mexican American Indians | 0.0 /100 | #286 | Tragic 83.0% |
| Guyanese | 0.0 /100 | #287 | Tragic 83.0% |
| Ottawa | 0.0 /100 | #288 | Tragic 83.0% |
| Immigrants | Micronesia | 0.0 /100 | #289 | Tragic 83.0% |
| Immigrants | Bangladesh | 0.0 /100 | #290 | Tragic 83.0% |
Demographics Similar to Hopi by In Labor Force | Age 25-29
In terms of in labor force | age 25-29, the demographic groups most similar to Hopi are Arapaho (76.6%, a difference of 0.060%), Pueblo (77.5%, a difference of 1.3%), Tohono O'odham (77.5%, a difference of 1.3%), Paiute (78.1%, a difference of 2.1%), and Immigrants from Yemen (78.2%, a difference of 2.2%).
| Demographics | Rating | Rank | In Labor Force | Age 25-29 |
| Sioux | 0.0 /100 | #333 | Tragic 79.7% |
| Yuman | 0.0 /100 | #334 | Tragic 79.3% |
| Natives/Alaskans | 0.0 /100 | #335 | Tragic 79.3% |
| Apache | 0.0 /100 | #336 | Tragic 79.2% |
| Crow | 0.0 /100 | #337 | Tragic 78.6% |
| Lumbee | 0.0 /100 | #338 | Tragic 78.3% |
| Immigrants | Yemen | 0.0 /100 | #339 | Tragic 78.2% |
| Paiute | 0.0 /100 | #340 | Tragic 78.1% |
| Tohono O'odham | 0.0 /100 | #341 | Tragic 77.5% |
| Pueblo | 0.0 /100 | #342 | Tragic 77.5% |
| Arapaho | 0.0 /100 | #343 | Tragic 76.6% |
| Hopi | 0.0 /100 | #344 | Tragic 76.5% |
| Navajo | 0.0 /100 | #345 | Tragic 74.6% |
| Pima | 0.0 /100 | #346 | Tragic 74.3% |
| Yup'ik | 0.0 /100 | #347 | Tragic 73.1% |