Menominee vs Immigrants from Cameroon Births to Unmarried Women
COMPARE
Menominee
Immigrants from Cameroon
Births to Unmarried Women
Births to Unmarried Women Comparison
Menominee
Immigrants from Cameroon
51.1%
BIRTHS TO UNMARRIED WOMEN
0.0/ 100
METRIC RATING
342nd/ 347
METRIC RANK
34.7%
BIRTHS TO UNMARRIED WOMEN
1.6/ 100
METRIC RATING
236th/ 347
METRIC RANK
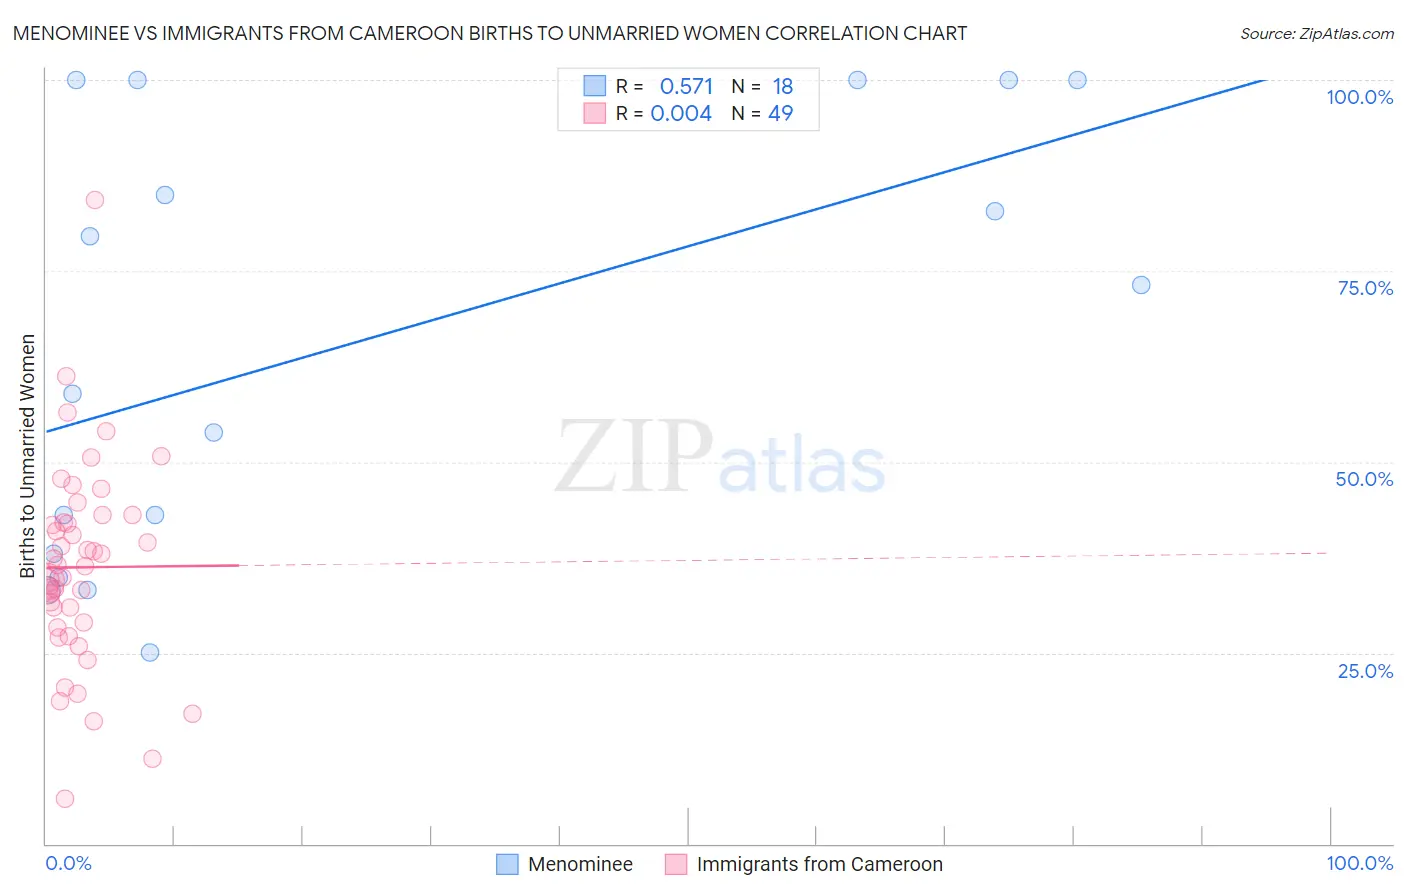
Menominee vs Immigrants from Cameroon Births to Unmarried Women Correlation Chart
The statistical analysis conducted on geographies consisting of 44,867,256 people shows a substantial positive correlation between the proportion of Menominee and percentage of births to unmarried women in the United States with a correlation coefficient (R) of 0.571 and weighted average of 51.1%. Similarly, the statistical analysis conducted on geographies consisting of 128,569,403 people shows no correlation between the proportion of Immigrants from Cameroon and percentage of births to unmarried women in the United States with a correlation coefficient (R) of 0.004 and weighted average of 34.7%, a difference of 47.2%.
Births to Unmarried Women Correlation Summary
| Measurement | Menominee | Immigrants from Cameroon |
| Minimum | 25.0% | 5.9% |
| Maximum | 100.0% | 84.3% |
| Range | 75.0% | 78.4% |
| Mean | 65.8% | 36.2% |
| Median | 66.0% | 36.4% |
| Interquartile 25% (IQ1) | 38.0% | 28.6% |
| Interquartile 75% (IQ3) | 100.0% | 42.5% |
| Interquartile Range (IQR) | 62.0% | 13.9% |
| Standard Deviation (Sample) | 28.2% | 13.4% |
| Standard Deviation (Population) | 27.4% | 13.2% |
Similar Demographics by Births to Unmarried Women
Demographics Similar to Menominee by Births to Unmarried Women
In terms of births to unmarried women, the demographic groups most similar to Menominee are Hopi (50.8%, a difference of 0.59%), Pima (51.5%, a difference of 0.70%), Navajo (51.5%, a difference of 0.74%), Inupiat (52.1%, a difference of 1.9%), and Tohono O'odham (49.8%, a difference of 2.5%).
| Demographics | Rating | Rank | Births to Unmarried Women |
| Blacks/African Americans | 0.0 /100 | #333 | Tragic 44.3% |
| Yuman | 0.0 /100 | #334 | Tragic 44.4% |
| Colville | 0.0 /100 | #335 | Tragic 45.3% |
| Puerto Ricans | 0.0 /100 | #336 | Tragic 45.7% |
| Houma | 0.0 /100 | #337 | Tragic 46.6% |
| Arapaho | 0.0 /100 | #338 | Tragic 47.1% |
| Lumbee | 0.0 /100 | #339 | Tragic 48.2% |
| Tohono O'odham | 0.0 /100 | #340 | Tragic 49.8% |
| Hopi | 0.0 /100 | #341 | Tragic 50.8% |
| Menominee | 0.0 /100 | #342 | Tragic 51.1% |
| Pima | 0.0 /100 | #343 | Tragic 51.5% |
| Navajo | 0.0 /100 | #344 | Tragic 51.5% |
| Inupiat | 0.0 /100 | #345 | Tragic 52.1% |
| Pueblo | 0.0 /100 | #346 | Tragic 53.7% |
| Yup'ik | 0.0 /100 | #347 | Tragic 56.4% |
Demographics Similar to Immigrants from Cameroon by Births to Unmarried Women
In terms of births to unmarried women, the demographic groups most similar to Immigrants from Cameroon are Marshallese (34.8%, a difference of 0.070%), Immigrants from Cambodia (34.8%, a difference of 0.13%), Sierra Leonean (34.9%, a difference of 0.36%), Immigrants from Middle Africa (34.9%, a difference of 0.61%), and Immigrants from Ghana (34.5%, a difference of 0.63%).
| Demographics | Rating | Rank | Births to Unmarried Women |
| Immigrants | Sierra Leone | 3.1 /100 | #229 | Tragic 34.2% |
| Ghanaians | 3.1 /100 | #230 | Tragic 34.3% |
| Native Hawaiians | 2.9 /100 | #231 | Tragic 34.3% |
| French Canadians | 2.5 /100 | #232 | Tragic 34.4% |
| Bangladeshis | 2.5 /100 | #233 | Tragic 34.4% |
| Immigrants | Zaire | 2.3 /100 | #234 | Tragic 34.5% |
| Immigrants | Ghana | 2.2 /100 | #235 | Tragic 34.5% |
| Immigrants | Cameroon | 1.6 /100 | #236 | Tragic 34.7% |
| Marshallese | 1.6 /100 | #237 | Tragic 34.8% |
| Immigrants | Cambodia | 1.6 /100 | #238 | Tragic 34.8% |
| Sierra Leoneans | 1.4 /100 | #239 | Tragic 34.9% |
| Immigrants | Middle Africa | 1.2 /100 | #240 | Tragic 34.9% |
| Immigrants | Guyana | 1.2 /100 | #241 | Tragic 35.0% |
| Indonesians | 1.2 /100 | #242 | Tragic 35.0% |
| Japanese | 0.9 /100 | #243 | Tragic 35.2% |