Immigrants from Australia vs Ghanaian Family Households
COMPARE
Immigrants from Australia
Ghanaian
Family Households
Family Households Comparison
Immigrants from Australia
Ghanaians
61.3%
FAMILY HOUSEHOLDS
0.0/ 100
METRIC RATING
330th/ 347
METRIC RANK
63.5%
FAMILY HOUSEHOLDS
2.1/ 100
METRIC RATING
236th/ 347
METRIC RANK
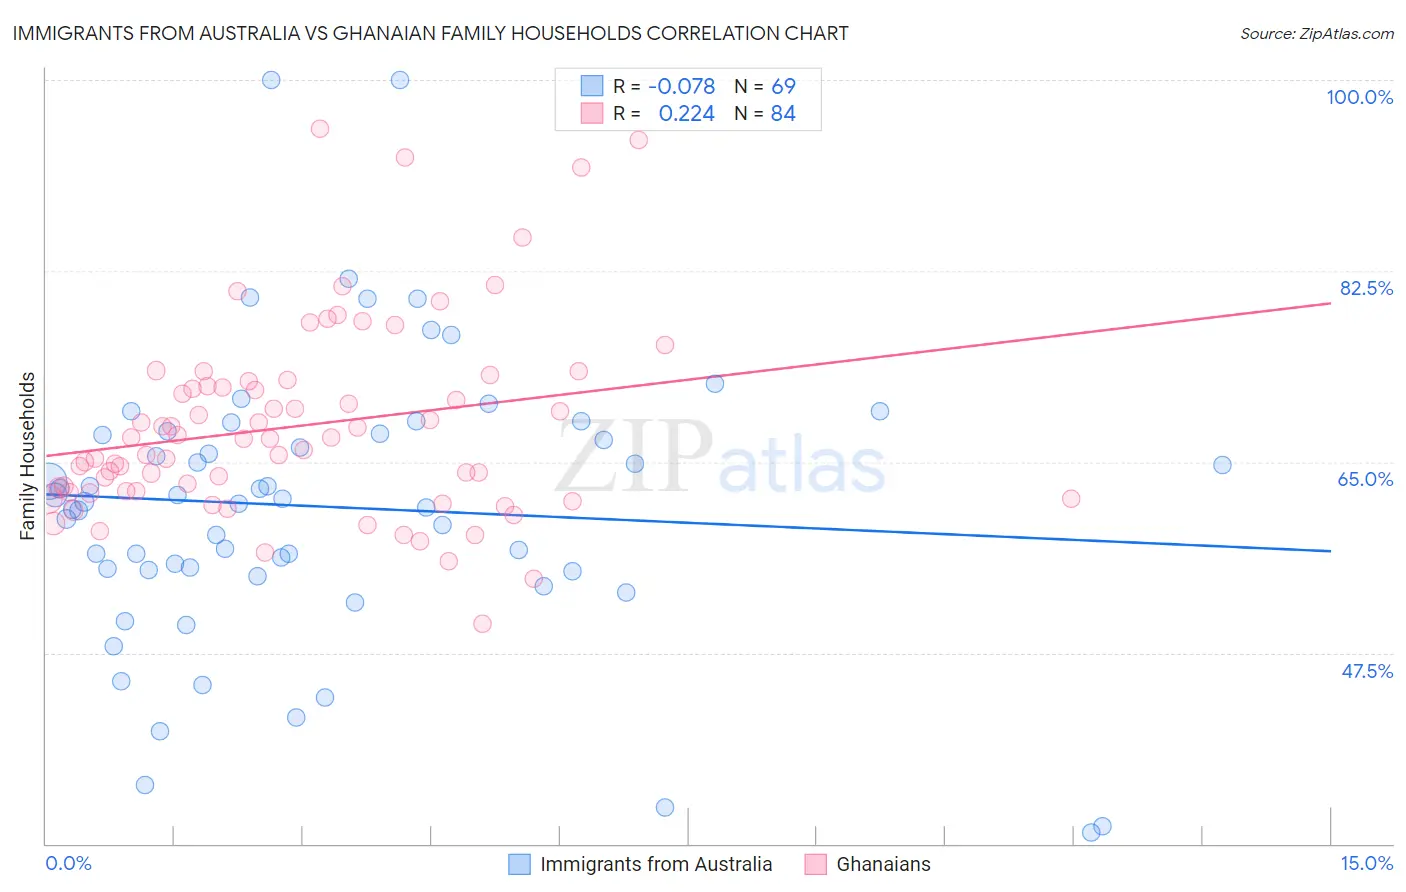
Immigrants from Australia vs Ghanaian Family Households Correlation Chart
The statistical analysis conducted on geographies consisting of 227,146,773 people shows a slight negative correlation between the proportion of Immigrants from Australia and percentage of family households in the United States with a correlation coefficient (R) of -0.078 and weighted average of 61.3%. Similarly, the statistical analysis conducted on geographies consisting of 190,523,422 people shows a weak positive correlation between the proportion of Ghanaians and percentage of family households in the United States with a correlation coefficient (R) of 0.224 and weighted average of 63.5%, a difference of 3.5%.
Family Households Correlation Summary
| Measurement | Immigrants from Australia | Ghanaian |
| Minimum | 31.0% | 50.2% |
| Maximum | 100.0% | 95.6% |
| Range | 69.0% | 45.4% |
| Mean | 60.9% | 68.3% |
| Median | 61.3% | 67.1% |
| Interquartile 25% (IQ1) | 55.1% | 62.3% |
| Interquartile 75% (IQ3) | 67.6% | 72.1% |
| Interquartile Range (IQR) | 12.6% | 9.9% |
| Standard Deviation (Sample) | 13.1% | 8.9% |
| Standard Deviation (Population) | 13.1% | 8.8% |
Similar Demographics by Family Households
Demographics Similar to Immigrants from Australia by Family Households
In terms of family households, the demographic groups most similar to Immigrants from Australia are Immigrants from France (61.3%, a difference of 0.0%), Ethiopian (61.2%, a difference of 0.080%), Cambodian (61.4%, a difference of 0.14%), Kiowa (61.4%, a difference of 0.16%), and Immigrants from Ethiopia (61.2%, a difference of 0.16%).
| Demographics | Rating | Rank | Family Households |
| Tlingit-Haida | 0.0 /100 | #323 | Tragic 61.6% |
| Immigrants | West Indies | 0.0 /100 | #324 | Tragic 61.6% |
| Immigrants | Switzerland | 0.0 /100 | #325 | Tragic 61.6% |
| Indonesians | 0.0 /100 | #326 | Tragic 61.5% |
| Blacks/African Americans | 0.0 /100 | #327 | Tragic 61.5% |
| Kiowa | 0.0 /100 | #328 | Tragic 61.4% |
| Cambodians | 0.0 /100 | #329 | Tragic 61.4% |
| Immigrants | Australia | 0.0 /100 | #330 | Tragic 61.3% |
| Immigrants | France | 0.0 /100 | #331 | Tragic 61.3% |
| Ethiopians | 0.0 /100 | #332 | Tragic 61.2% |
| Immigrants | Ethiopia | 0.0 /100 | #333 | Tragic 61.2% |
| Immigrants | Eastern Africa | 0.0 /100 | #334 | Tragic 61.1% |
| Carpatho Rusyns | 0.0 /100 | #335 | Tragic 61.1% |
| German Russians | 0.0 /100 | #336 | Tragic 60.9% |
| Soviet Union | 0.0 /100 | #337 | Tragic 60.9% |
Demographics Similar to Ghanaians by Family Households
In terms of family households, the demographic groups most similar to Ghanaians are Comanche (63.5%, a difference of 0.0%), Albanian (63.5%, a difference of 0.010%), Immigrants from Zimbabwe (63.5%, a difference of 0.010%), Finnish (63.5%, a difference of 0.040%), and Aleut (63.4%, a difference of 0.040%).
| Demographics | Rating | Rank | Family Households |
| Bulgarians | 3.4 /100 | #229 | Tragic 63.6% |
| Immigrants | Brazil | 3.0 /100 | #230 | Tragic 63.6% |
| Immigrants | Greece | 2.9 /100 | #231 | Tragic 63.5% |
| Immigrants | Northern Africa | 2.6 /100 | #232 | Tragic 63.5% |
| Immigrants | Armenia | 2.6 /100 | #233 | Tragic 63.5% |
| Finns | 2.3 /100 | #234 | Tragic 63.5% |
| Albanians | 2.2 /100 | #235 | Tragic 63.5% |
| Ghanaians | 2.1 /100 | #236 | Tragic 63.5% |
| Comanche | 2.1 /100 | #237 | Tragic 63.5% |
| Immigrants | Zimbabwe | 2.0 /100 | #238 | Tragic 63.5% |
| Aleuts | 1.9 /100 | #239 | Tragic 63.4% |
| South Africans | 1.9 /100 | #240 | Tragic 63.4% |
| Immigrants | St. Vincent and the Grenadines | 1.9 /100 | #241 | Tragic 63.4% |
| Immigrants | Israel | 1.8 /100 | #242 | Tragic 63.4% |
| Immigrants | Czechoslovakia | 1.8 /100 | #243 | Tragic 63.4% |