Immigrants from Armenia vs Iraqi Family Households
COMPARE
Immigrants from Armenia
Iraqi
Family Households
Family Households Comparison
Immigrants from Armenia
Iraqis
63.5%
FAMILY HOUSEHOLDS
2.6/ 100
METRIC RATING
233rd/ 347
METRIC RANK
64.4%
FAMILY HOUSEHOLDS
56.0/ 100
METRIC RATING
169th/ 347
METRIC RANK
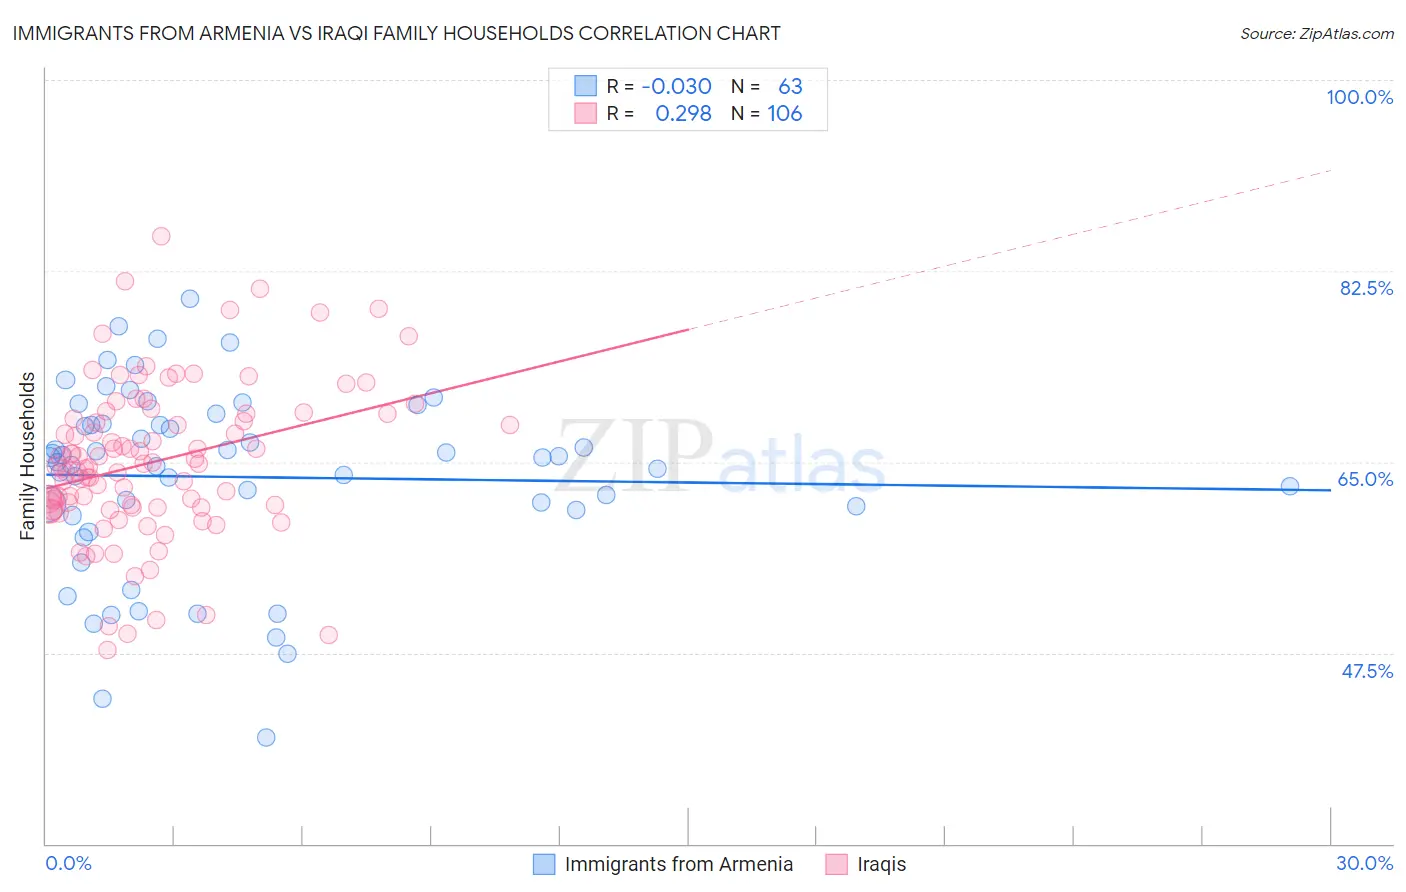
Immigrants from Armenia vs Iraqi Family Households Correlation Chart
The statistical analysis conducted on geographies consisting of 97,683,198 people shows no correlation between the proportion of Immigrants from Armenia and percentage of family households in the United States with a correlation coefficient (R) of -0.030 and weighted average of 63.5%. Similarly, the statistical analysis conducted on geographies consisting of 170,639,485 people shows a weak positive correlation between the proportion of Iraqis and percentage of family households in the United States with a correlation coefficient (R) of 0.298 and weighted average of 64.4%, a difference of 1.3%.
Family Households Correlation Summary
| Measurement | Immigrants from Armenia | Iraqi |
| Minimum | 39.7% | 47.7% |
| Maximum | 79.9% | 85.7% |
| Range | 40.2% | 38.0% |
| Mean | 63.6% | 65.0% |
| Median | 65.3% | 64.7% |
| Interquartile 25% (IQ1) | 60.6% | 60.8% |
| Interquartile 75% (IQ3) | 68.5% | 69.4% |
| Interquartile Range (IQR) | 7.9% | 8.6% |
| Standard Deviation (Sample) | 8.3% | 7.1% |
| Standard Deviation (Population) | 8.3% | 7.1% |
Similar Demographics by Family Households
Demographics Similar to Immigrants from Armenia by Family Households
In terms of family households, the demographic groups most similar to Immigrants from Armenia are Immigrants from Northern Africa (63.5%, a difference of 0.010%), Finnish (63.5%, a difference of 0.030%), Immigrants from Greece (63.5%, a difference of 0.050%), Albanian (63.5%, a difference of 0.050%), and Immigrants from Brazil (63.6%, a difference of 0.060%).
| Demographics | Rating | Rank | Family Households |
| Immigrants | Bahamas | 4.2 /100 | #226 | Tragic 63.6% |
| Trinidadians and Tobagonians | 4.1 /100 | #227 | Tragic 63.6% |
| Blackfeet | 3.6 /100 | #228 | Tragic 63.6% |
| Bulgarians | 3.4 /100 | #229 | Tragic 63.6% |
| Immigrants | Brazil | 3.0 /100 | #230 | Tragic 63.6% |
| Immigrants | Greece | 2.9 /100 | #231 | Tragic 63.5% |
| Immigrants | Northern Africa | 2.6 /100 | #232 | Tragic 63.5% |
| Immigrants | Armenia | 2.6 /100 | #233 | Tragic 63.5% |
| Finns | 2.3 /100 | #234 | Tragic 63.5% |
| Albanians | 2.2 /100 | #235 | Tragic 63.5% |
| Ghanaians | 2.1 /100 | #236 | Tragic 63.5% |
| Comanche | 2.1 /100 | #237 | Tragic 63.5% |
| Immigrants | Zimbabwe | 2.0 /100 | #238 | Tragic 63.5% |
| Aleuts | 1.9 /100 | #239 | Tragic 63.4% |
| South Africans | 1.9 /100 | #240 | Tragic 63.4% |
Demographics Similar to Iraqis by Family Households
In terms of family households, the demographic groups most similar to Iraqis are Armenian (64.4%, a difference of 0.0%), Honduran (64.4%, a difference of 0.020%), Ute (64.3%, a difference of 0.020%), Irish (64.4%, a difference of 0.030%), and Dutch West Indian (64.3%, a difference of 0.030%).
| Demographics | Rating | Rank | Family Households |
| British | 61.6 /100 | #162 | Good 64.4% |
| Chickasaw | 61.5 /100 | #163 | Good 64.4% |
| Immigrants | Nigeria | 60.1 /100 | #164 | Good 64.4% |
| Immigrants | Southern Europe | 60.0 /100 | #165 | Good 64.4% |
| Scotch-Irish | 59.2 /100 | #166 | Average 64.4% |
| Irish | 57.9 /100 | #167 | Average 64.4% |
| Hondurans | 57.5 /100 | #168 | Average 64.4% |
| Iraqis | 56.0 /100 | #169 | Average 64.4% |
| Armenians | 55.9 /100 | #170 | Average 64.4% |
| Ute | 54.6 /100 | #171 | Average 64.3% |
| Dutch West Indians | 53.9 /100 | #172 | Average 64.3% |
| Immigrants | Sierra Leone | 52.5 /100 | #173 | Average 64.3% |
| Immigrants | Germany | 50.0 /100 | #174 | Average 64.3% |
| Bangladeshis | 44.3 /100 | #175 | Average 64.3% |
| Vietnamese | 43.6 /100 | #176 | Average 64.2% |