Immigrants from Armenia vs Central American Indian Family Households
COMPARE
Immigrants from Armenia
Central American Indian
Family Households
Family Households Comparison
Immigrants from Armenia
Central American Indians
63.5%
FAMILY HOUSEHOLDS
2.6/ 100
METRIC RATING
233rd/ 347
METRIC RANK
65.2%
FAMILY HOUSEHOLDS
98.3/ 100
METRIC RATING
99th/ 347
METRIC RANK
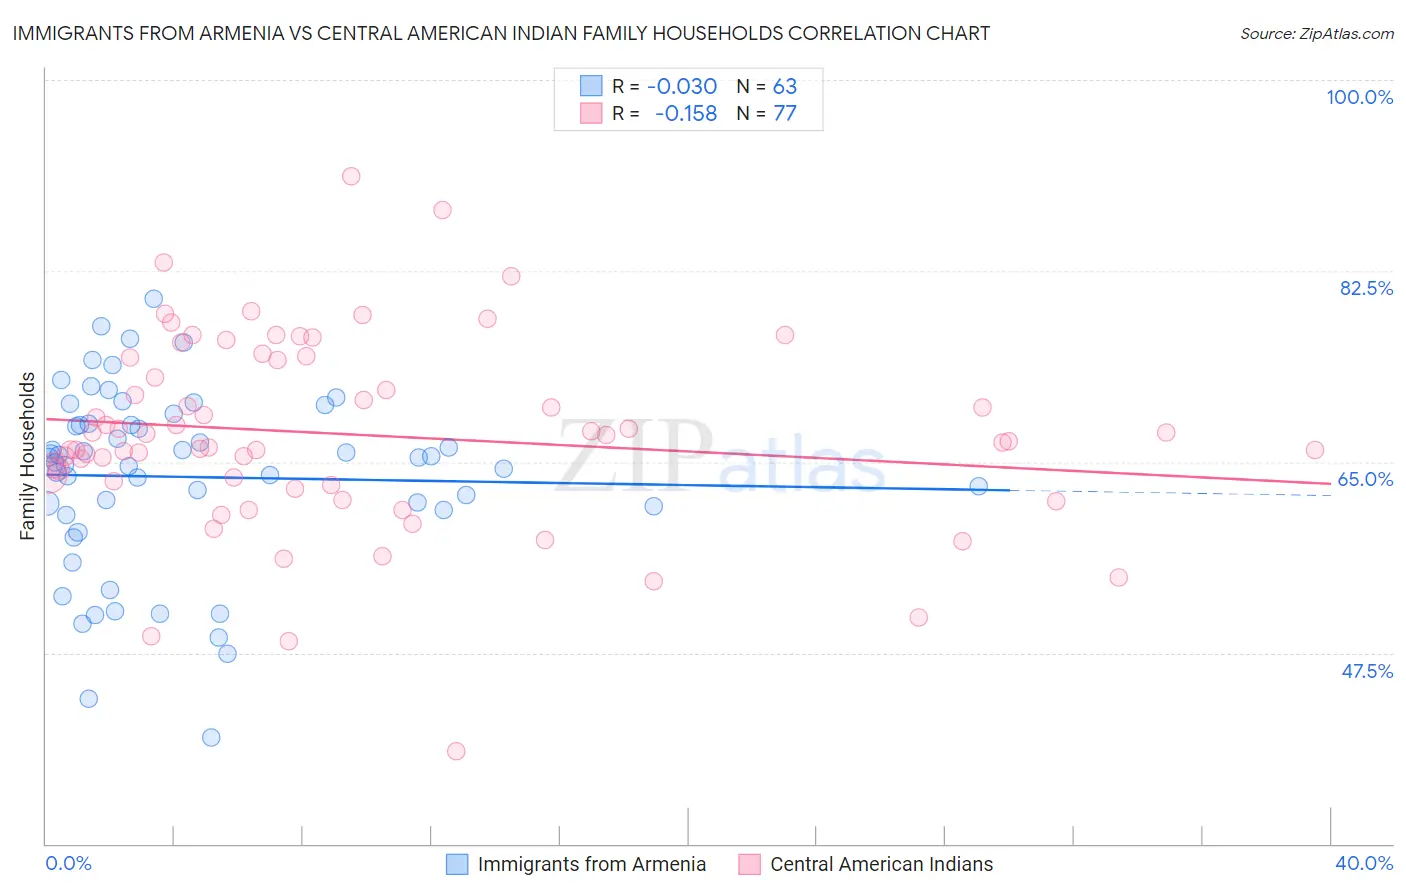
Immigrants from Armenia vs Central American Indian Family Households Correlation Chart
The statistical analysis conducted on geographies consisting of 97,683,198 people shows no correlation between the proportion of Immigrants from Armenia and percentage of family households in the United States with a correlation coefficient (R) of -0.030 and weighted average of 63.5%. Similarly, the statistical analysis conducted on geographies consisting of 326,061,567 people shows a poor negative correlation between the proportion of Central American Indians and percentage of family households in the United States with a correlation coefficient (R) of -0.158 and weighted average of 65.2%, a difference of 2.6%.
Family Households Correlation Summary
| Measurement | Immigrants from Armenia | Central American Indian |
| Minimum | 39.7% | 38.5% |
| Maximum | 79.9% | 91.2% |
| Range | 40.2% | 52.8% |
| Mean | 63.6% | 67.5% |
| Median | 65.3% | 66.9% |
| Interquartile 25% (IQ1) | 60.6% | 63.1% |
| Interquartile 75% (IQ3) | 68.5% | 74.4% |
| Interquartile Range (IQR) | 7.9% | 11.3% |
| Standard Deviation (Sample) | 8.3% | 8.9% |
| Standard Deviation (Population) | 8.3% | 8.8% |
Similar Demographics by Family Households
Demographics Similar to Immigrants from Armenia by Family Households
In terms of family households, the demographic groups most similar to Immigrants from Armenia are Immigrants from Northern Africa (63.5%, a difference of 0.010%), Finnish (63.5%, a difference of 0.030%), Immigrants from Greece (63.5%, a difference of 0.050%), Albanian (63.5%, a difference of 0.050%), and Immigrants from Brazil (63.6%, a difference of 0.060%).
| Demographics | Rating | Rank | Family Households |
| Immigrants | Bahamas | 4.2 /100 | #226 | Tragic 63.6% |
| Trinidadians and Tobagonians | 4.1 /100 | #227 | Tragic 63.6% |
| Blackfeet | 3.6 /100 | #228 | Tragic 63.6% |
| Bulgarians | 3.4 /100 | #229 | Tragic 63.6% |
| Immigrants | Brazil | 3.0 /100 | #230 | Tragic 63.6% |
| Immigrants | Greece | 2.9 /100 | #231 | Tragic 63.5% |
| Immigrants | Northern Africa | 2.6 /100 | #232 | Tragic 63.5% |
| Immigrants | Armenia | 2.6 /100 | #233 | Tragic 63.5% |
| Finns | 2.3 /100 | #234 | Tragic 63.5% |
| Albanians | 2.2 /100 | #235 | Tragic 63.5% |
| Ghanaians | 2.1 /100 | #236 | Tragic 63.5% |
| Comanche | 2.1 /100 | #237 | Tragic 63.5% |
| Immigrants | Zimbabwe | 2.0 /100 | #238 | Tragic 63.5% |
| Aleuts | 1.9 /100 | #239 | Tragic 63.4% |
| South Africans | 1.9 /100 | #240 | Tragic 63.4% |
Demographics Similar to Central American Indians by Family Households
In terms of family households, the demographic groups most similar to Central American Indians are Immigrants from Syria (65.2%, a difference of 0.020%), Haitian (65.2%, a difference of 0.040%), Chilean (65.2%, a difference of 0.040%), Swiss (65.2%, a difference of 0.060%), and Guatemalan (65.2%, a difference of 0.060%).
| Demographics | Rating | Rank | Family Households |
| Hopi | 98.8 /100 | #92 | Exceptional 65.3% |
| Guyanese | 98.8 /100 | #93 | Exceptional 65.3% |
| Immigrants | Poland | 98.7 /100 | #94 | Exceptional 65.2% |
| Immigrants | Portugal | 98.6 /100 | #95 | Exceptional 65.2% |
| Swiss | 98.6 /100 | #96 | Exceptional 65.2% |
| Guatemalans | 98.6 /100 | #97 | Exceptional 65.2% |
| Immigrants | Syria | 98.4 /100 | #98 | Exceptional 65.2% |
| Central American Indians | 98.3 /100 | #99 | Exceptional 65.2% |
| Haitians | 98.1 /100 | #100 | Exceptional 65.2% |
| Chileans | 98.1 /100 | #101 | Exceptional 65.2% |
| Immigrants | Sri Lanka | 98.0 /100 | #102 | Exceptional 65.1% |
| Indians (Asian) | 97.9 /100 | #103 | Exceptional 65.1% |
| Spaniards | 97.8 /100 | #104 | Exceptional 65.1% |
| English | 97.4 /100 | #105 | Exceptional 65.1% |
| Whites/Caucasians | 97.3 /100 | #106 | Exceptional 65.1% |