Immigrants from Armenia vs Brazilian Single Father Households
COMPARE
Immigrants from Armenia
Brazilian
Single Father Households
Single Father Households Comparison
Immigrants from Armenia
Brazilians
2.1%
SINGLE FATHER HOUSEHOLDS
99.5/ 100
METRIC RATING
89th/ 347
METRIC RANK
2.2%
SINGLE FATHER HOUSEHOLDS
92.8/ 100
METRIC RATING
139th/ 347
METRIC RANK
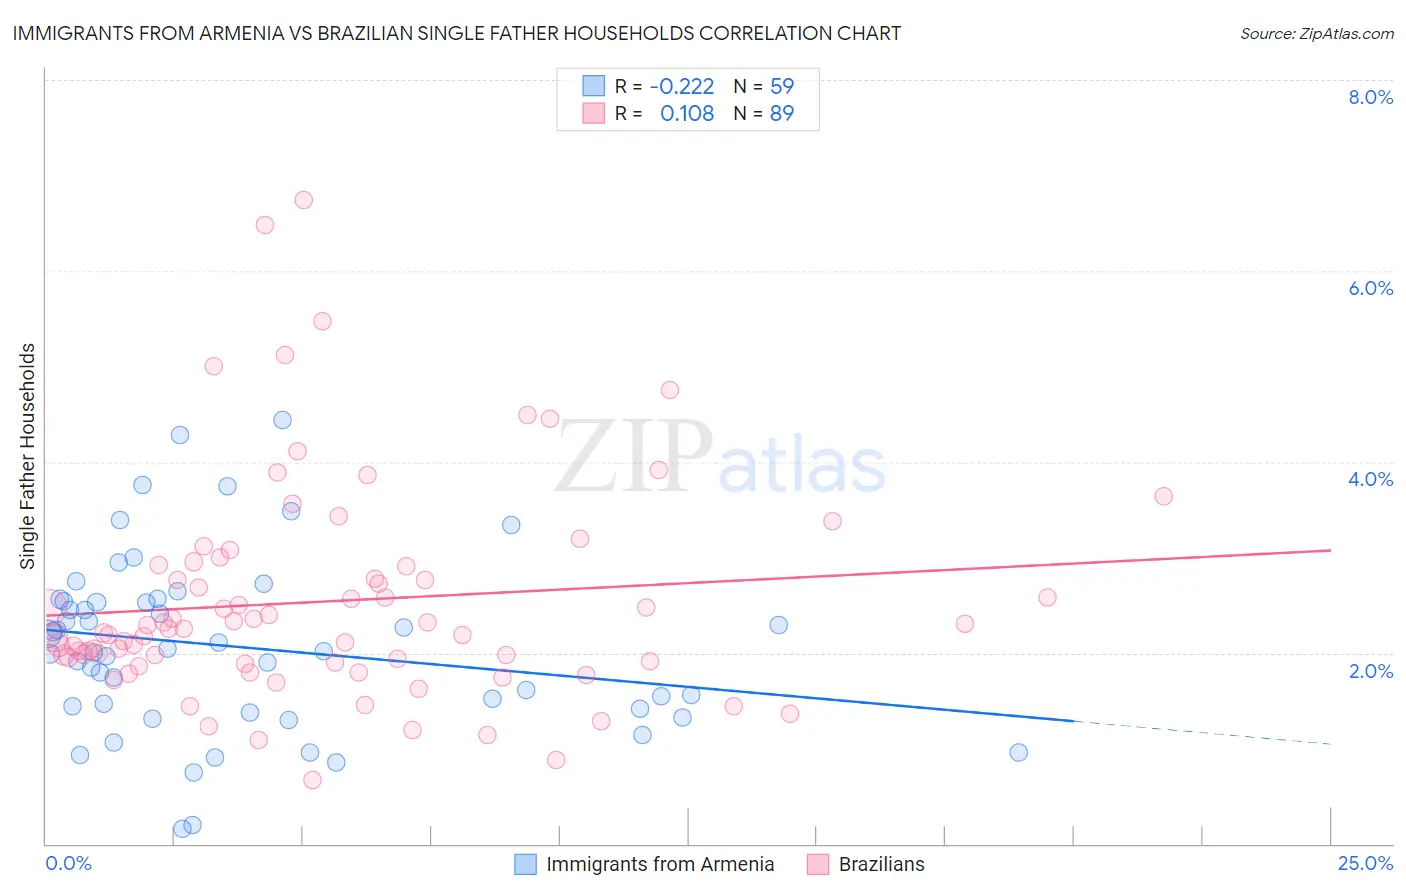
Immigrants from Armenia vs Brazilian Single Father Households Correlation Chart
The statistical analysis conducted on geographies consisting of 97,547,351 people shows a weak negative correlation between the proportion of Immigrants from Armenia and percentage of single father households in the United States with a correlation coefficient (R) of -0.222 and weighted average of 2.1%. Similarly, the statistical analysis conducted on geographies consisting of 321,679,292 people shows a poor positive correlation between the proportion of Brazilians and percentage of single father households in the United States with a correlation coefficient (R) of 0.108 and weighted average of 2.2%, a difference of 5.4%.
Single Father Households Correlation Summary
| Measurement | Immigrants from Armenia | Brazilian |
| Minimum | 0.15% | 0.67% |
| Maximum | 4.4% | 6.7% |
| Range | 4.3% | 6.1% |
| Mean | 2.1% | 2.5% |
| Median | 2.0% | 2.2% |
| Interquartile 25% (IQ1) | 1.4% | 1.9% |
| Interquartile 75% (IQ3) | 2.5% | 2.9% |
| Interquartile Range (IQR) | 1.1% | 1.0% |
| Standard Deviation (Sample) | 0.91% | 1.1% |
| Standard Deviation (Population) | 0.91% | 1.1% |
Similar Demographics by Single Father Households
Demographics Similar to Immigrants from Armenia by Single Father Households
In terms of single father households, the demographic groups most similar to Immigrants from Armenia are Immigrants from Pakistan (2.1%, a difference of 0.010%), Bhutanese (2.1%, a difference of 0.050%), Lithuanian (2.1%, a difference of 0.18%), Immigrants from Guyana (2.1%, a difference of 0.25%), and Romanian (2.1%, a difference of 0.34%).
| Demographics | Rating | Rank | Single Father Households |
| New Zealanders | 99.7 /100 | #82 | Exceptional 2.1% |
| Greeks | 99.7 /100 | #83 | Exceptional 2.1% |
| Carpatho Rusyns | 99.6 /100 | #84 | Exceptional 2.1% |
| Immigrants | Hungary | 99.6 /100 | #85 | Exceptional 2.1% |
| Asians | 99.6 /100 | #86 | Exceptional 2.1% |
| Lithuanians | 99.5 /100 | #87 | Exceptional 2.1% |
| Bhutanese | 99.5 /100 | #88 | Exceptional 2.1% |
| Immigrants | Armenia | 99.5 /100 | #89 | Exceptional 2.1% |
| Immigrants | Pakistan | 99.5 /100 | #90 | Exceptional 2.1% |
| Immigrants | Guyana | 99.4 /100 | #91 | Exceptional 2.1% |
| Romanians | 99.4 /100 | #92 | Exceptional 2.1% |
| Croatians | 99.3 /100 | #93 | Exceptional 2.1% |
| Ukrainians | 99.3 /100 | #94 | Exceptional 2.1% |
| Bermudans | 99.2 /100 | #95 | Exceptional 2.1% |
| Arabs | 99.2 /100 | #96 | Exceptional 2.1% |
Demographics Similar to Brazilians by Single Father Households
In terms of single father households, the demographic groups most similar to Brazilians are British (2.2%, a difference of 0.010%), Laotian (2.2%, a difference of 0.090%), Luxembourger (2.2%, a difference of 0.13%), Immigrants from Nepal (2.2%, a difference of 0.19%), and West Indian (2.2%, a difference of 0.42%).
| Demographics | Rating | Rank | Single Father Households |
| Poles | 96.5 /100 | #132 | Exceptional 2.2% |
| Taiwanese | 96.3 /100 | #133 | Exceptional 2.2% |
| Zimbabweans | 95.1 /100 | #134 | Exceptional 2.2% |
| Syrians | 94.8 /100 | #135 | Exceptional 2.2% |
| Chileans | 94.5 /100 | #136 | Exceptional 2.2% |
| Austrians | 94.2 /100 | #137 | Exceptional 2.2% |
| West Indians | 94.1 /100 | #138 | Exceptional 2.2% |
| Brazilians | 92.8 /100 | #139 | Exceptional 2.2% |
| British | 92.8 /100 | #140 | Exceptional 2.2% |
| Laotians | 92.5 /100 | #141 | Exceptional 2.2% |
| Luxembourgers | 92.3 /100 | #142 | Exceptional 2.2% |
| Immigrants | Nepal | 92.1 /100 | #143 | Exceptional 2.2% |
| Slovaks | 90.7 /100 | #144 | Exceptional 2.2% |
| Immigrants | Zimbabwe | 90.2 /100 | #145 | Exceptional 2.2% |
| Northern Europeans | 89.8 /100 | #146 | Excellent 2.2% |