Immigrants from Armenia vs German Russian Single Father Households
COMPARE
Immigrants from Armenia
German Russian
Single Father Households
Single Father Households Comparison
Immigrants from Armenia
German Russians
2.1%
SINGLE FATHER HOUSEHOLDS
99.5/ 100
METRIC RATING
89th/ 347
METRIC RANK
2.4%
SINGLE FATHER HOUSEHOLDS
25.7/ 100
METRIC RATING
202nd/ 347
METRIC RANK
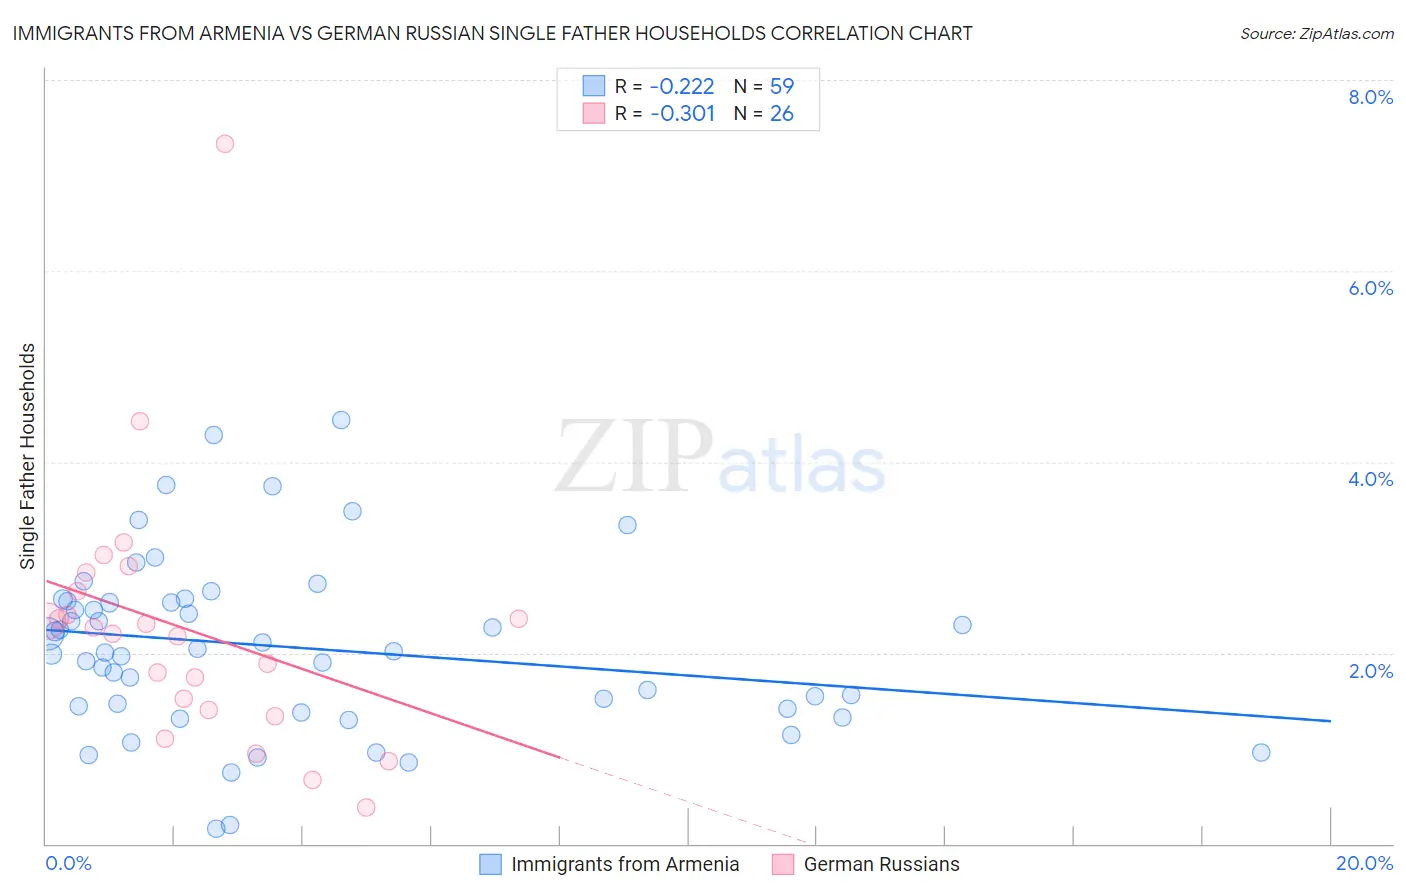
Immigrants from Armenia vs German Russian Single Father Households Correlation Chart
The statistical analysis conducted on geographies consisting of 97,547,351 people shows a weak negative correlation between the proportion of Immigrants from Armenia and percentage of single father households in the United States with a correlation coefficient (R) of -0.222 and weighted average of 2.1%. Similarly, the statistical analysis conducted on geographies consisting of 96,318,608 people shows a mild negative correlation between the proportion of German Russians and percentage of single father households in the United States with a correlation coefficient (R) of -0.301 and weighted average of 2.4%, a difference of 12.7%.
Single Father Households Correlation Summary
| Measurement | Immigrants from Armenia | German Russian |
| Minimum | 0.15% | 0.38% |
| Maximum | 4.4% | 7.3% |
| Range | 4.3% | 7.0% |
| Mean | 2.1% | 2.2% |
| Median | 2.0% | 2.2% |
| Interquartile 25% (IQ1) | 1.4% | 1.4% |
| Interquartile 75% (IQ3) | 2.5% | 2.7% |
| Interquartile Range (IQR) | 1.1% | 1.3% |
| Standard Deviation (Sample) | 0.91% | 1.4% |
| Standard Deviation (Population) | 0.91% | 1.3% |
Similar Demographics by Single Father Households
Demographics Similar to Immigrants from Armenia by Single Father Households
In terms of single father households, the demographic groups most similar to Immigrants from Armenia are Immigrants from Pakistan (2.1%, a difference of 0.010%), Bhutanese (2.1%, a difference of 0.050%), Lithuanian (2.1%, a difference of 0.18%), Immigrants from Guyana (2.1%, a difference of 0.25%), and Romanian (2.1%, a difference of 0.34%).
| Demographics | Rating | Rank | Single Father Households |
| New Zealanders | 99.7 /100 | #82 | Exceptional 2.1% |
| Greeks | 99.7 /100 | #83 | Exceptional 2.1% |
| Carpatho Rusyns | 99.6 /100 | #84 | Exceptional 2.1% |
| Immigrants | Hungary | 99.6 /100 | #85 | Exceptional 2.1% |
| Asians | 99.6 /100 | #86 | Exceptional 2.1% |
| Lithuanians | 99.5 /100 | #87 | Exceptional 2.1% |
| Bhutanese | 99.5 /100 | #88 | Exceptional 2.1% |
| Immigrants | Armenia | 99.5 /100 | #89 | Exceptional 2.1% |
| Immigrants | Pakistan | 99.5 /100 | #90 | Exceptional 2.1% |
| Immigrants | Guyana | 99.4 /100 | #91 | Exceptional 2.1% |
| Romanians | 99.4 /100 | #92 | Exceptional 2.1% |
| Croatians | 99.3 /100 | #93 | Exceptional 2.1% |
| Ukrainians | 99.3 /100 | #94 | Exceptional 2.1% |
| Bermudans | 99.2 /100 | #95 | Exceptional 2.1% |
| Arabs | 99.2 /100 | #96 | Exceptional 2.1% |
Demographics Similar to German Russians by Single Father Households
In terms of single father households, the demographic groups most similar to German Russians are Immigrants from Uganda (2.4%, a difference of 0.030%), French Canadian (2.4%, a difference of 0.10%), Ecuadorian (2.4%, a difference of 0.12%), Immigrants from Vietnam (2.4%, a difference of 0.13%), and Peruvian (2.4%, a difference of 0.13%).
| Demographics | Rating | Rank | Single Father Households |
| Immigrants | Philippines | 28.7 /100 | #195 | Fair 2.4% |
| Kenyans | 28.0 /100 | #196 | Fair 2.4% |
| Germans | 28.0 /100 | #197 | Fair 2.4% |
| Scandinavians | 27.4 /100 | #198 | Fair 2.4% |
| Immigrants | Vietnam | 27.1 /100 | #199 | Fair 2.4% |
| Peruvians | 27.1 /100 | #200 | Fair 2.4% |
| Immigrants | Uganda | 26.0 /100 | #201 | Fair 2.4% |
| German Russians | 25.7 /100 | #202 | Fair 2.4% |
| French Canadians | 24.7 /100 | #203 | Fair 2.4% |
| Ecuadorians | 24.5 /100 | #204 | Fair 2.4% |
| Immigrants | Afghanistan | 24.2 /100 | #205 | Fair 2.4% |
| Koreans | 24.1 /100 | #206 | Fair 2.4% |
| Whites/Caucasians | 22.6 /100 | #207 | Fair 2.4% |
| Immigrants | Kenya | 20.3 /100 | #208 | Fair 2.4% |
| Immigrants | Peru | 19.3 /100 | #209 | Poor 2.4% |