Immigrants from Argentina vs Navajo Married-couple Households
COMPARE
Immigrants from Argentina
Navajo
Married-couple Households
Married-couple Households Comparison
Immigrants from Argentina
Navajo
47.2%
MARRIED-COUPLE HOUSEHOLDS
86.0/ 100
METRIC RATING
135th/ 347
METRIC RANK
40.1%
MARRIED-COUPLE HOUSEHOLDS
0.0/ 100
METRIC RATING
324th/ 347
METRIC RANK
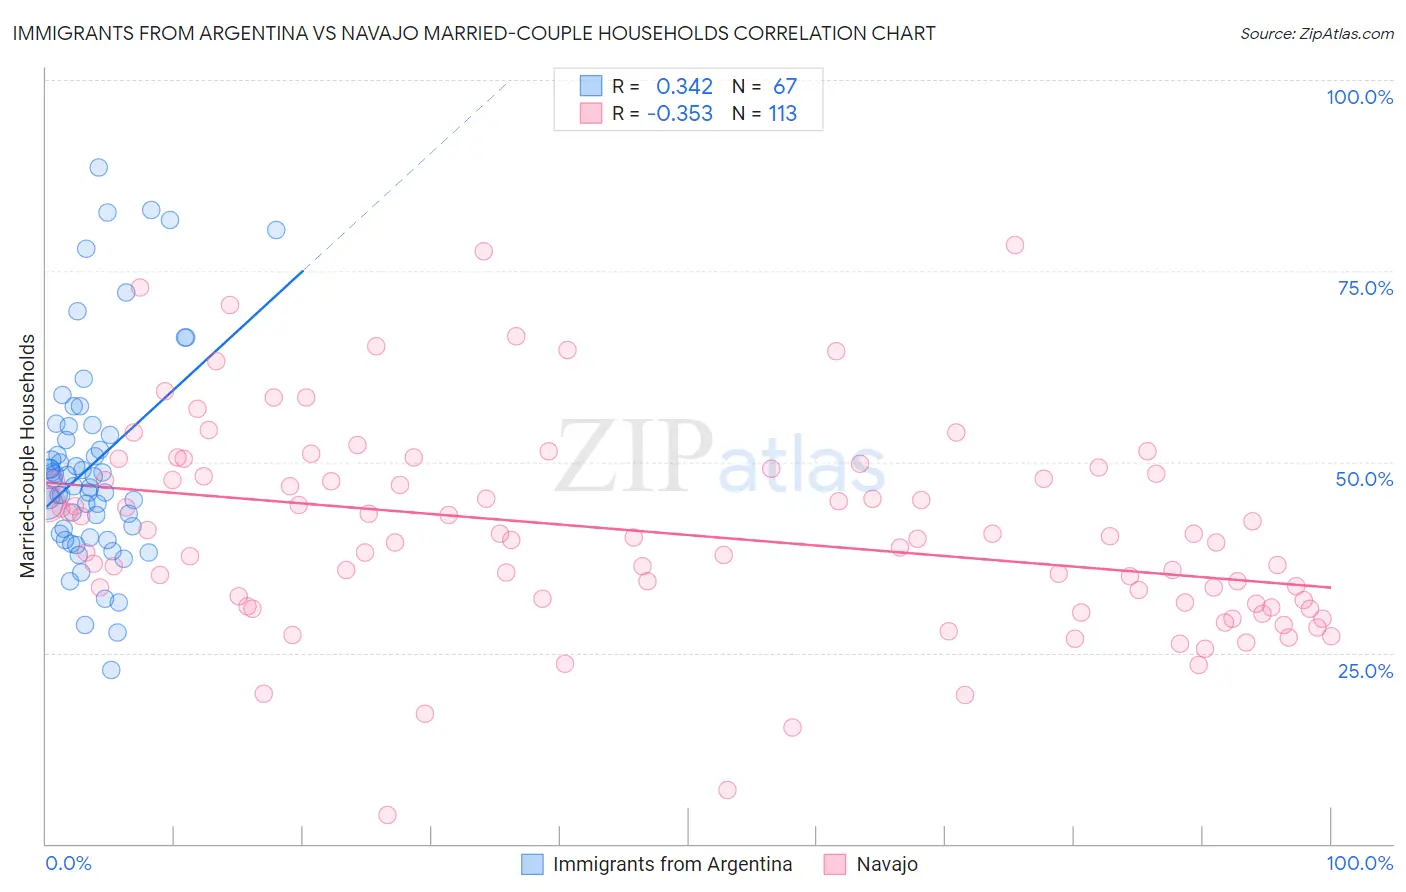
Immigrants from Argentina vs Navajo Married-couple Households Correlation Chart
The statistical analysis conducted on geographies consisting of 264,359,680 people shows a mild positive correlation between the proportion of Immigrants from Argentina and percentage of married-couple family households in the United States with a correlation coefficient (R) of 0.342 and weighted average of 47.2%. Similarly, the statistical analysis conducted on geographies consisting of 224,747,945 people shows a mild negative correlation between the proportion of Navajo and percentage of married-couple family households in the United States with a correlation coefficient (R) of -0.353 and weighted average of 40.1%, a difference of 17.9%.
Married-couple Households Correlation Summary
| Measurement | Immigrants from Argentina | Navajo |
| Minimum | 22.7% | 3.8% |
| Maximum | 88.5% | 78.4% |
| Range | 65.8% | 74.6% |
| Mean | 49.7% | 40.7% |
| Median | 47.9% | 39.9% |
| Interquartile 25% (IQ1) | 40.5% | 31.5% |
| Interquartile 75% (IQ3) | 54.6% | 48.3% |
| Interquartile Range (IQR) | 14.1% | 16.8% |
| Standard Deviation (Sample) | 13.9% | 13.4% |
| Standard Deviation (Population) | 13.8% | 13.3% |
Similar Demographics by Married-couple Households
Demographics Similar to Immigrants from Argentina by Married-couple Households
In terms of married-couple households, the demographic groups most similar to Immigrants from Argentina are Immigrants from Greece (47.2%, a difference of 0.0%), South African (47.3%, a difference of 0.040%), New Zealander (47.2%, a difference of 0.050%), Immigrants from Ukraine (47.3%, a difference of 0.060%), and Immigrants from Malaysia (47.2%, a difference of 0.060%).
| Demographics | Rating | Rank | Married-couple Households |
| Immigrants | Peru | 87.9 /100 | #128 | Excellent 47.3% |
| Immigrants | Iraq | 87.8 /100 | #129 | Excellent 47.3% |
| Immigrants | Hungary | 87.8 /100 | #130 | Excellent 47.3% |
| Immigrants | Denmark | 87.5 /100 | #131 | Excellent 47.3% |
| Immigrants | Ukraine | 86.7 /100 | #132 | Excellent 47.3% |
| South Africans | 86.4 /100 | #133 | Excellent 47.3% |
| Immigrants | Greece | 86.0 /100 | #134 | Excellent 47.2% |
| Immigrants | Argentina | 86.0 /100 | #135 | Excellent 47.2% |
| New Zealanders | 85.3 /100 | #136 | Excellent 47.2% |
| Immigrants | Malaysia | 85.2 /100 | #137 | Excellent 47.2% |
| Immigrants | Afghanistan | 85.1 /100 | #138 | Excellent 47.2% |
| Immigrants | Sweden | 84.7 /100 | #139 | Excellent 47.2% |
| Spanish | 84.5 /100 | #140 | Excellent 47.2% |
| Costa Ricans | 84.4 /100 | #141 | Excellent 47.2% |
| Spaniards | 84.1 /100 | #142 | Excellent 47.2% |
Demographics Similar to Navajo by Married-couple Households
In terms of married-couple households, the demographic groups most similar to Navajo are Immigrants from Zaire (40.1%, a difference of 0.010%), Puerto Rican (40.1%, a difference of 0.010%), Pueblo (40.0%, a difference of 0.23%), Immigrants from Liberia (40.3%, a difference of 0.67%), and U.S. Virgin Islander (39.8%, a difference of 0.69%).
| Demographics | Rating | Rank | Married-couple Households |
| Immigrants | Jamaica | 0.0 /100 | #317 | Tragic 40.7% |
| Liberians | 0.0 /100 | #318 | Tragic 40.7% |
| Bahamians | 0.0 /100 | #319 | Tragic 40.5% |
| West Indians | 0.0 /100 | #320 | Tragic 40.3% |
| Immigrants | Liberia | 0.0 /100 | #321 | Tragic 40.3% |
| Immigrants | Zaire | 0.0 /100 | #322 | Tragic 40.1% |
| Puerto Ricans | 0.0 /100 | #323 | Tragic 40.1% |
| Navajo | 0.0 /100 | #324 | Tragic 40.1% |
| Pueblo | 0.0 /100 | #325 | Tragic 40.0% |
| U.S. Virgin Islanders | 0.0 /100 | #326 | Tragic 39.8% |
| Lumbee | 0.0 /100 | #327 | Tragic 39.6% |
| Barbadians | 0.0 /100 | #328 | Tragic 39.4% |
| Immigrants | Dominica | 0.0 /100 | #329 | Tragic 39.4% |
| Immigrants | Barbados | 0.0 /100 | #330 | Tragic 39.2% |
| Immigrants | Congo | 0.0 /100 | #331 | Tragic 39.0% |