Palestinian vs Navajo Married-couple Households
COMPARE
Palestinian
Navajo
Married-couple Households
Married-couple Households Comparison
Palestinians
Navajo
48.0%
MARRIED-COUPLE HOUSEHOLDS
96.9/ 100
METRIC RATING
92nd/ 347
METRIC RANK
40.1%
MARRIED-COUPLE HOUSEHOLDS
0.0/ 100
METRIC RATING
324th/ 347
METRIC RANK
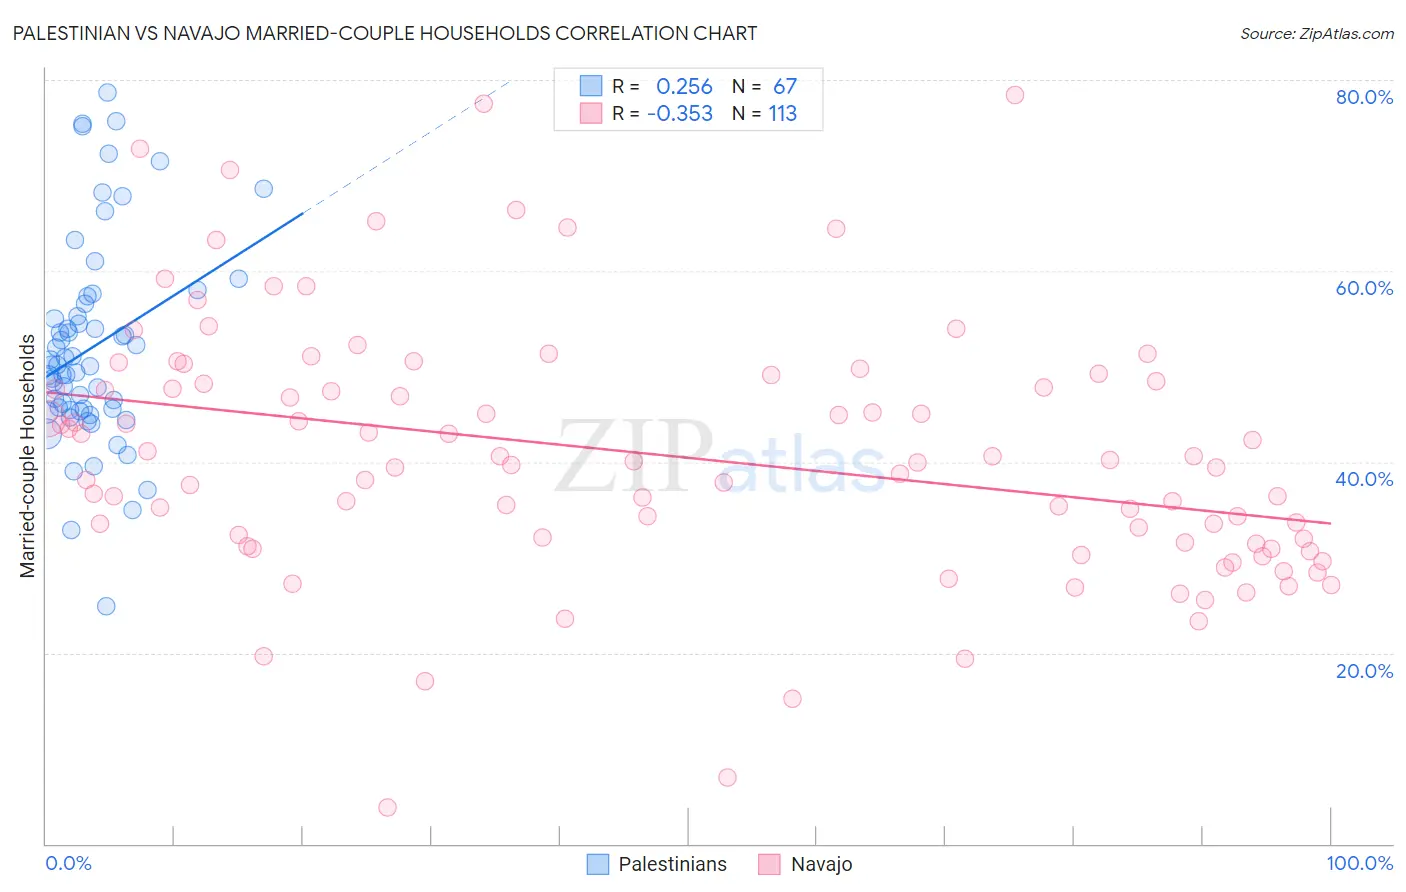
Palestinian vs Navajo Married-couple Households Correlation Chart
The statistical analysis conducted on geographies consisting of 216,389,787 people shows a weak positive correlation between the proportion of Palestinians and percentage of married-couple family households in the United States with a correlation coefficient (R) of 0.256 and weighted average of 48.0%. Similarly, the statistical analysis conducted on geographies consisting of 224,747,945 people shows a mild negative correlation between the proportion of Navajo and percentage of married-couple family households in the United States with a correlation coefficient (R) of -0.353 and weighted average of 40.1%, a difference of 19.7%.
Married-couple Households Correlation Summary
| Measurement | Palestinian | Navajo |
| Minimum | 24.9% | 3.8% |
| Maximum | 78.7% | 78.4% |
| Range | 53.9% | 74.6% |
| Mean | 52.0% | 40.7% |
| Median | 50.1% | 39.9% |
| Interquartile 25% (IQ1) | 45.5% | 31.5% |
| Interquartile 75% (IQ3) | 56.6% | 48.3% |
| Interquartile Range (IQR) | 11.1% | 16.8% |
| Standard Deviation (Sample) | 10.7% | 13.4% |
| Standard Deviation (Population) | 10.6% | 13.3% |
Similar Demographics by Married-couple Households
Demographics Similar to Palestinians by Married-couple Households
In terms of married-couple households, the demographic groups most similar to Palestinians are Immigrants from Moldova (48.0%, a difference of 0.020%), Lebanese (47.9%, a difference of 0.020%), American (47.9%, a difference of 0.020%), Immigrants from Belgium (47.9%, a difference of 0.060%), and French (48.0%, a difference of 0.080%).
| Demographics | Rating | Rank | Married-couple Households |
| Immigrants | Israel | 97.4 /100 | #85 | Exceptional 48.0% |
| Belgians | 97.4 /100 | #86 | Exceptional 48.0% |
| Immigrants | Ireland | 97.3 /100 | #87 | Exceptional 48.0% |
| Afghans | 97.3 /100 | #88 | Exceptional 48.0% |
| Cypriots | 97.2 /100 | #89 | Exceptional 48.0% |
| French | 97.2 /100 | #90 | Exceptional 48.0% |
| Immigrants | Moldova | 97.0 /100 | #91 | Exceptional 48.0% |
| Palestinians | 96.9 /100 | #92 | Exceptional 48.0% |
| Lebanese | 96.9 /100 | #93 | Exceptional 47.9% |
| Americans | 96.9 /100 | #94 | Exceptional 47.9% |
| Immigrants | Belgium | 96.8 /100 | #95 | Exceptional 47.9% |
| Immigrants | Egypt | 96.6 /100 | #96 | Exceptional 47.9% |
| Latvians | 96.5 /100 | #97 | Exceptional 47.9% |
| Immigrants | North Macedonia | 96.4 /100 | #98 | Exceptional 47.9% |
| Immigrants | Austria | 96.4 /100 | #99 | Exceptional 47.9% |
Demographics Similar to Navajo by Married-couple Households
In terms of married-couple households, the demographic groups most similar to Navajo are Immigrants from Zaire (40.1%, a difference of 0.010%), Puerto Rican (40.1%, a difference of 0.010%), Pueblo (40.0%, a difference of 0.23%), Immigrants from Liberia (40.3%, a difference of 0.67%), and U.S. Virgin Islander (39.8%, a difference of 0.69%).
| Demographics | Rating | Rank | Married-couple Households |
| Immigrants | Jamaica | 0.0 /100 | #317 | Tragic 40.7% |
| Liberians | 0.0 /100 | #318 | Tragic 40.7% |
| Bahamians | 0.0 /100 | #319 | Tragic 40.5% |
| West Indians | 0.0 /100 | #320 | Tragic 40.3% |
| Immigrants | Liberia | 0.0 /100 | #321 | Tragic 40.3% |
| Immigrants | Zaire | 0.0 /100 | #322 | Tragic 40.1% |
| Puerto Ricans | 0.0 /100 | #323 | Tragic 40.1% |
| Navajo | 0.0 /100 | #324 | Tragic 40.1% |
| Pueblo | 0.0 /100 | #325 | Tragic 40.0% |
| U.S. Virgin Islanders | 0.0 /100 | #326 | Tragic 39.8% |
| Lumbee | 0.0 /100 | #327 | Tragic 39.6% |
| Barbadians | 0.0 /100 | #328 | Tragic 39.4% |
| Immigrants | Dominica | 0.0 /100 | #329 | Tragic 39.4% |
| Immigrants | Barbados | 0.0 /100 | #330 | Tragic 39.2% |
| Immigrants | Congo | 0.0 /100 | #331 | Tragic 39.0% |