Immigrants from Africa vs Malaysian Single Mother Households
COMPARE
Immigrants from Africa
Malaysian
Single Mother Households
Single Mother Households Comparison
Immigrants from Africa
Malaysians
7.3%
SINGLE MOTHER HOUSEHOLDS
0.4/ 100
METRIC RATING
250th/ 347
METRIC RANK
7.3%
SINGLE MOTHER HOUSEHOLDS
0.3/ 100
METRIC RATING
251st/ 347
METRIC RANK
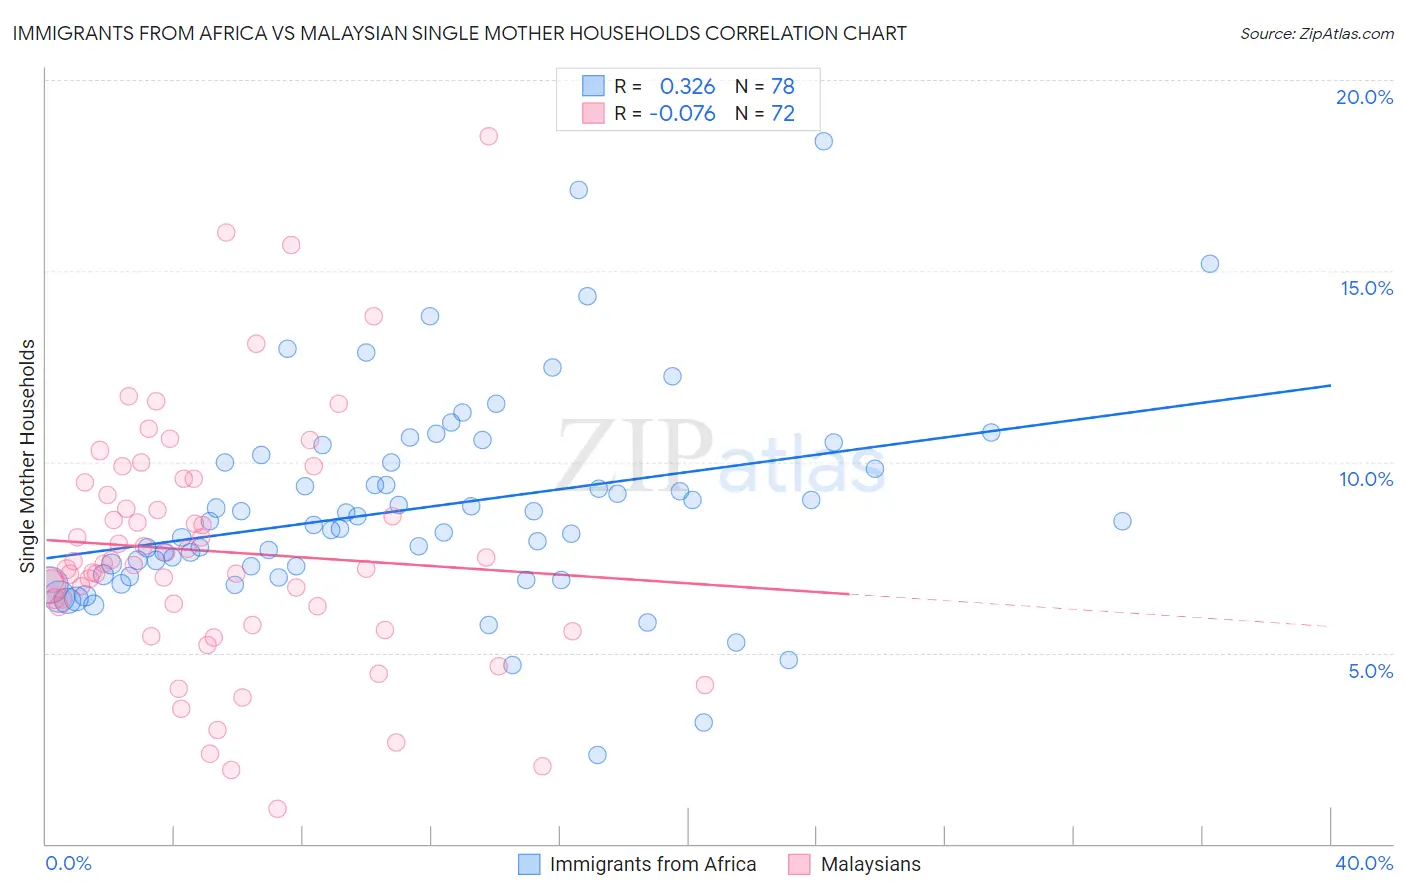
Immigrants from Africa vs Malaysian Single Mother Households Correlation Chart
The statistical analysis conducted on geographies consisting of 467,655,792 people shows a mild positive correlation between the proportion of Immigrants from Africa and percentage of single mother households in the United States with a correlation coefficient (R) of 0.326 and weighted average of 7.3%. Similarly, the statistical analysis conducted on geographies consisting of 225,856,339 people shows a slight negative correlation between the proportion of Malaysians and percentage of single mother households in the United States with a correlation coefficient (R) of -0.076 and weighted average of 7.3%, a difference of 0.34%.
Single Mother Households Correlation Summary
| Measurement | Immigrants from Africa | Malaysian |
| Minimum | 2.3% | 0.92% |
| Maximum | 18.4% | 18.5% |
| Range | 16.1% | 17.6% |
| Mean | 8.8% | 7.7% |
| Median | 8.4% | 7.3% |
| Interquartile 25% (IQ1) | 7.0% | 6.0% |
| Interquartile 75% (IQ3) | 10.0% | 9.3% |
| Interquartile Range (IQR) | 3.0% | 3.3% |
| Standard Deviation (Sample) | 2.7% | 3.2% |
| Standard Deviation (Population) | 2.7% | 3.2% |
Demographics Similar to Immigrants from Africa and Malaysians by Single Mother Households
In terms of single mother households, the demographic groups most similar to Immigrants from Africa are Bermudan (7.3%, a difference of 0.010%), Spanish American Indian (7.3%, a difference of 0.30%), Dutch West Indian (7.3%, a difference of 0.33%), Alaskan Athabascan (7.3%, a difference of 0.37%), and Nicaraguan (7.2%, a difference of 0.58%). Similarly, the demographic groups most similar to Malaysians are Alaskan Athabascan (7.3%, a difference of 0.020%), Bermudan (7.3%, a difference of 0.36%), Cajun (7.3%, a difference of 0.41%), Immigrants from Ecuador (7.3%, a difference of 0.46%), and Spanish American Indian (7.3%, a difference of 0.64%).
| Demographics | Rating | Rank | Single Mother Households |
| Immigrants | Panama | 0.7 /100 | #240 | Tragic 7.2% |
| Immigrants | Portugal | 0.6 /100 | #241 | Tragic 7.2% |
| Fijians | 0.6 /100 | #242 | Tragic 7.2% |
| Ecuadorians | 0.6 /100 | #243 | Tragic 7.2% |
| Cubans | 0.6 /100 | #244 | Tragic 7.2% |
| Immigrants | Cambodia | 0.5 /100 | #245 | Tragic 7.2% |
| Nicaraguans | 0.5 /100 | #246 | Tragic 7.2% |
| Dutch West Indians | 0.4 /100 | #247 | Tragic 7.3% |
| Spanish American Indians | 0.4 /100 | #248 | Tragic 7.3% |
| Bermudans | 0.4 /100 | #249 | Tragic 7.3% |
| Immigrants | Africa | 0.4 /100 | #250 | Tragic 7.3% |
| Malaysians | 0.3 /100 | #251 | Tragic 7.3% |
| Alaskan Athabascans | 0.3 /100 | #252 | Tragic 7.3% |
| Cajuns | 0.3 /100 | #253 | Tragic 7.3% |
| Immigrants | Ecuador | 0.3 /100 | #254 | Tragic 7.3% |
| Mexican American Indians | 0.2 /100 | #255 | Tragic 7.4% |
| Seminole | 0.2 /100 | #256 | Tragic 7.4% |
| Alaska Natives | 0.2 /100 | #257 | Tragic 7.4% |
| Pueblo | 0.2 /100 | #258 | Tragic 7.4% |
| Immigrants | Yemen | 0.2 /100 | #259 | Tragic 7.4% |
| Immigrants | Zaire | 0.2 /100 | #260 | Tragic 7.4% |