Immigrants from Africa vs U.S. Virgin Islander Single Mother Households
COMPARE
Immigrants from Africa
U.S. Virgin Islander
Single Mother Households
Single Mother Households Comparison
Immigrants from Africa
U.S. Virgin Islanders
7.3%
SINGLE MOTHER HOUSEHOLDS
0.4/ 100
METRIC RATING
250th/ 347
METRIC RANK
8.6%
SINGLE MOTHER HOUSEHOLDS
0.0/ 100
METRIC RATING
332nd/ 347
METRIC RANK
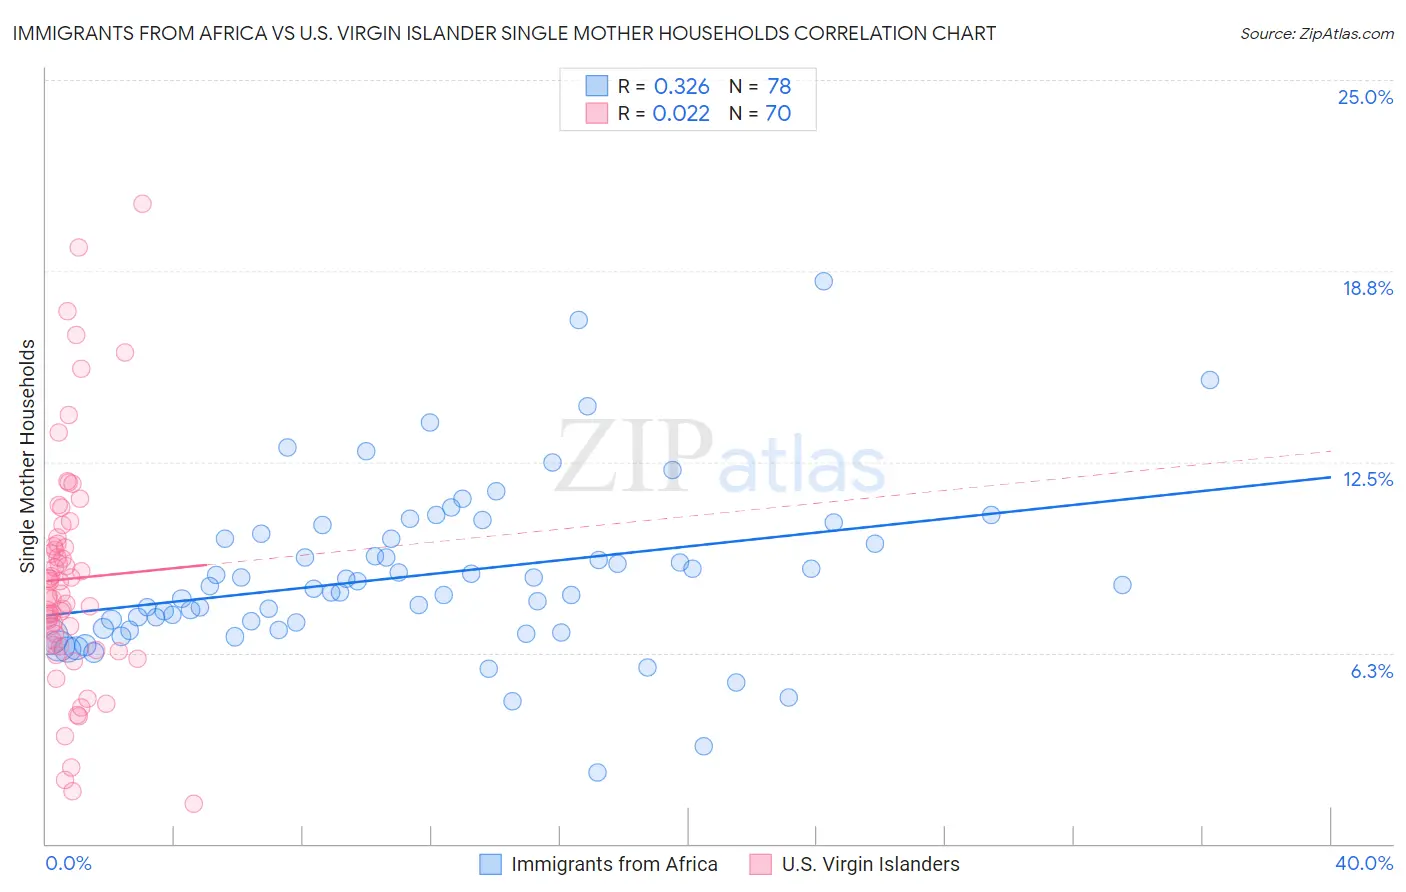
Immigrants from Africa vs U.S. Virgin Islander Single Mother Households Correlation Chart
The statistical analysis conducted on geographies consisting of 467,655,792 people shows a mild positive correlation between the proportion of Immigrants from Africa and percentage of single mother households in the United States with a correlation coefficient (R) of 0.326 and weighted average of 7.3%. Similarly, the statistical analysis conducted on geographies consisting of 87,484,063 people shows no correlation between the proportion of U.S. Virgin Islanders and percentage of single mother households in the United States with a correlation coefficient (R) of 0.022 and weighted average of 8.6%, a difference of 18.3%.
Single Mother Households Correlation Summary
| Measurement | Immigrants from Africa | U.S. Virgin Islander |
| Minimum | 2.3% | 1.3% |
| Maximum | 18.4% | 21.0% |
| Range | 16.1% | 19.7% |
| Mean | 8.8% | 8.7% |
| Median | 8.4% | 8.1% |
| Interquartile 25% (IQ1) | 7.0% | 6.5% |
| Interquartile 75% (IQ3) | 10.0% | 9.8% |
| Interquartile Range (IQR) | 3.0% | 3.3% |
| Standard Deviation (Sample) | 2.7% | 3.8% |
| Standard Deviation (Population) | 2.7% | 3.8% |
Similar Demographics by Single Mother Households
Demographics Similar to Immigrants from Africa by Single Mother Households
In terms of single mother households, the demographic groups most similar to Immigrants from Africa are Bermudan (7.3%, a difference of 0.010%), Spanish American Indian (7.3%, a difference of 0.30%), Dutch West Indian (7.3%, a difference of 0.33%), Malaysian (7.3%, a difference of 0.34%), and Alaskan Athabascan (7.3%, a difference of 0.37%).
| Demographics | Rating | Rank | Single Mother Households |
| Ecuadorians | 0.6 /100 | #243 | Tragic 7.2% |
| Cubans | 0.6 /100 | #244 | Tragic 7.2% |
| Immigrants | Cambodia | 0.5 /100 | #245 | Tragic 7.2% |
| Nicaraguans | 0.5 /100 | #246 | Tragic 7.2% |
| Dutch West Indians | 0.4 /100 | #247 | Tragic 7.3% |
| Spanish American Indians | 0.4 /100 | #248 | Tragic 7.3% |
| Bermudans | 0.4 /100 | #249 | Tragic 7.3% |
| Immigrants | Africa | 0.4 /100 | #250 | Tragic 7.3% |
| Malaysians | 0.3 /100 | #251 | Tragic 7.3% |
| Alaskan Athabascans | 0.3 /100 | #252 | Tragic 7.3% |
| Cajuns | 0.3 /100 | #253 | Tragic 7.3% |
| Immigrants | Ecuador | 0.3 /100 | #254 | Tragic 7.3% |
| Mexican American Indians | 0.2 /100 | #255 | Tragic 7.4% |
| Seminole | 0.2 /100 | #256 | Tragic 7.4% |
| Alaska Natives | 0.2 /100 | #257 | Tragic 7.4% |
Demographics Similar to U.S. Virgin Islanders by Single Mother Households
In terms of single mother households, the demographic groups most similar to U.S. Virgin Islanders are Liberian (8.6%, a difference of 0.33%), Immigrants from Liberia (8.7%, a difference of 1.1%), Immigrants from Dominica (8.7%, a difference of 1.4%), Puerto Rican (8.7%, a difference of 1.5%), and Inupiat (8.5%, a difference of 1.5%).
| Demographics | Rating | Rank | Single Mother Households |
| Immigrants | Caribbean | 0.0 /100 | #325 | Tragic 8.4% |
| British West Indians | 0.0 /100 | #326 | Tragic 8.4% |
| Immigrants | Haiti | 0.0 /100 | #327 | Tragic 8.4% |
| Yakama | 0.0 /100 | #328 | Tragic 8.4% |
| Hopi | 0.0 /100 | #329 | Tragic 8.5% |
| Inupiat | 0.0 /100 | #330 | Tragic 8.5% |
| Sioux | 0.0 /100 | #331 | Tragic 8.5% |
| U.S. Virgin Islanders | 0.0 /100 | #332 | Tragic 8.6% |
| Liberians | 0.0 /100 | #333 | Tragic 8.6% |
| Immigrants | Liberia | 0.0 /100 | #334 | Tragic 8.7% |
| Immigrants | Dominica | 0.0 /100 | #335 | Tragic 8.7% |
| Puerto Ricans | 0.0 /100 | #336 | Tragic 8.7% |
| Navajo | 0.0 /100 | #337 | Tragic 8.8% |
| Cape Verdeans | 0.0 /100 | #338 | Tragic 8.9% |
| Blacks/African Americans | 0.0 /100 | #339 | Tragic 9.0% |