Immigrants from Afghanistan vs Sudanese In Labor Force | Age 25-29
COMPARE
Immigrants from Afghanistan
Sudanese
In Labor Force | Age 25-29
In Labor Force | Age 25-29 Comparison
Immigrants from Afghanistan
Sudanese
84.4%
IN LABOR FORCE | AGE 25-29
15.6/ 100
METRIC RATING
203rd/ 347
METRIC RANK
85.9%
IN LABOR FORCE | AGE 25-29
100.0/ 100
METRIC RATING
25th/ 347
METRIC RANK
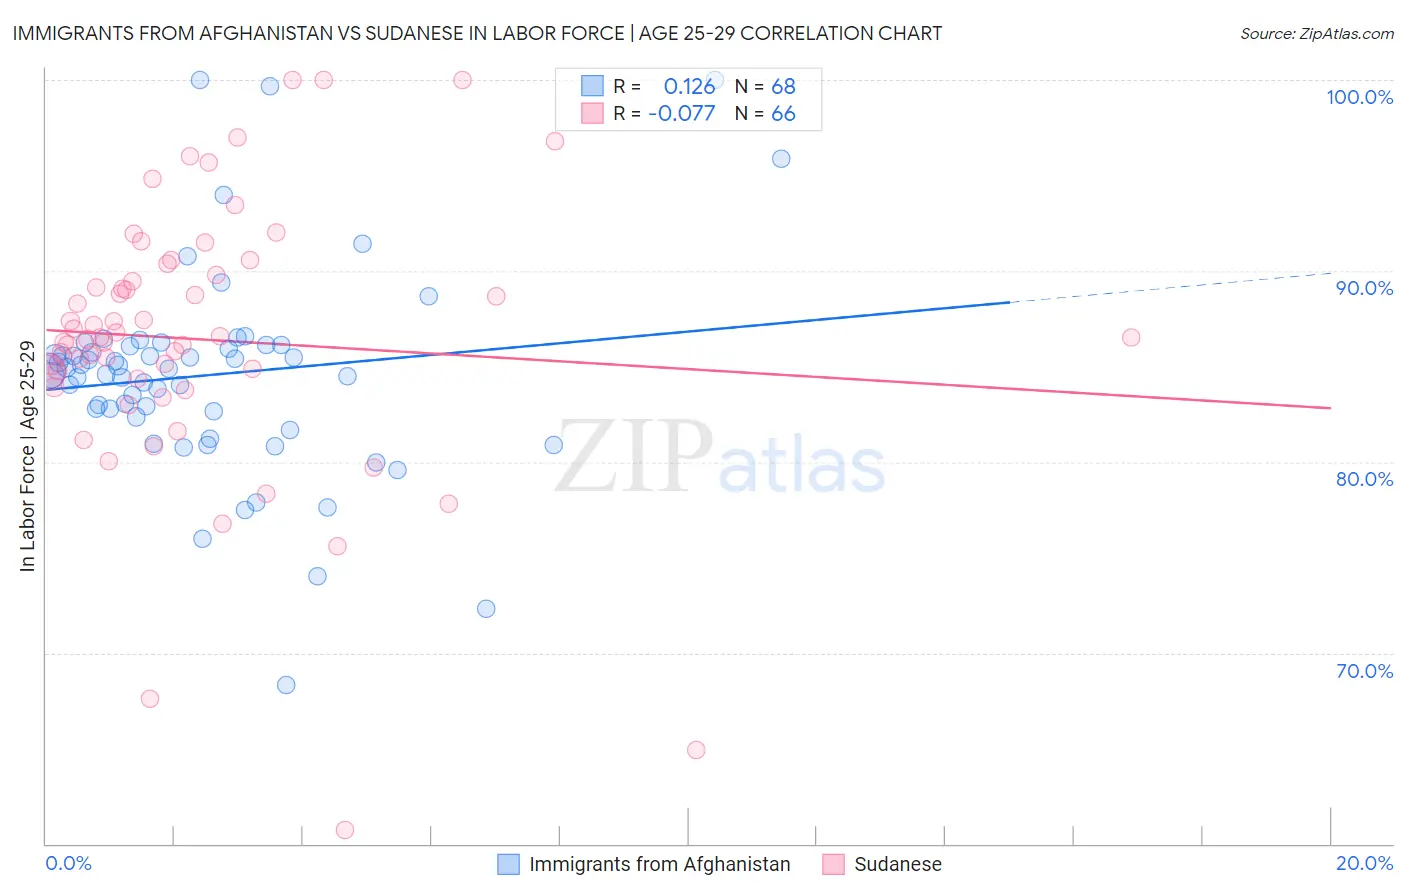
Immigrants from Afghanistan vs Sudanese In Labor Force | Age 25-29 Correlation Chart
The statistical analysis conducted on geographies consisting of 147,629,697 people shows a poor positive correlation between the proportion of Immigrants from Afghanistan and labor force participation rate among population between the ages 25 and 29 in the United States with a correlation coefficient (R) of 0.126 and weighted average of 84.4%. Similarly, the statistical analysis conducted on geographies consisting of 110,131,704 people shows a slight negative correlation between the proportion of Sudanese and labor force participation rate among population between the ages 25 and 29 in the United States with a correlation coefficient (R) of -0.077 and weighted average of 85.9%, a difference of 1.8%.
In Labor Force | Age 25-29 Correlation Summary
| Measurement | Immigrants from Afghanistan | Sudanese |
| Minimum | 68.3% | 60.7% |
| Maximum | 100.0% | 100.0% |
| Range | 31.7% | 39.3% |
| Mean | 84.5% | 86.4% |
| Median | 84.8% | 86.5% |
| Interquartile 25% (IQ1) | 82.5% | 84.3% |
| Interquartile 75% (IQ3) | 86.1% | 89.8% |
| Interquartile Range (IQR) | 3.6% | 5.5% |
| Standard Deviation (Sample) | 5.5% | 7.2% |
| Standard Deviation (Population) | 5.4% | 7.1% |
Similar Demographics by In Labor Force | Age 25-29
Demographics Similar to Immigrants from Afghanistan by In Labor Force | Age 25-29
In terms of in labor force | age 25-29, the demographic groups most similar to Immigrants from Afghanistan are Afghan (84.4%, a difference of 0.0%), Laotian (84.4%, a difference of 0.010%), Venezuelan (84.4%, a difference of 0.010%), Ecuadorian (84.4%, a difference of 0.010%), and Immigrants from Kazakhstan (84.4%, a difference of 0.020%).
| Demographics | Rating | Rank | In Labor Force | Age 25-29 |
| Immigrants | South Eastern Asia | 19.5 /100 | #196 | Poor 84.4% |
| Tlingit-Haida | 19.3 /100 | #197 | Poor 84.4% |
| Immigrants | Iraq | 19.0 /100 | #198 | Poor 84.4% |
| Immigrants | Germany | 18.3 /100 | #199 | Poor 84.4% |
| Immigrants | Kazakhstan | 17.5 /100 | #200 | Poor 84.4% |
| Laotians | 16.6 /100 | #201 | Poor 84.4% |
| Afghans | 15.9 /100 | #202 | Poor 84.4% |
| Immigrants | Afghanistan | 15.6 /100 | #203 | Poor 84.4% |
| Venezuelans | 15.1 /100 | #204 | Poor 84.4% |
| Ecuadorians | 14.8 /100 | #205 | Poor 84.4% |
| Immigrants | Cambodia | 14.3 /100 | #206 | Poor 84.4% |
| Immigrants | Armenia | 13.3 /100 | #207 | Poor 84.4% |
| Immigrants | Indonesia | 13.2 /100 | #208 | Poor 84.4% |
| Immigrants | Jordan | 12.8 /100 | #209 | Poor 84.4% |
| Chinese | 12.7 /100 | #210 | Poor 84.3% |
Demographics Similar to Sudanese by In Labor Force | Age 25-29
In terms of in labor force | age 25-29, the demographic groups most similar to Sudanese are Immigrants from Eastern Africa (86.0%, a difference of 0.010%), Immigrants from Uganda (86.0%, a difference of 0.020%), Cambodian (86.0%, a difference of 0.040%), Maltese (86.0%, a difference of 0.050%), and Immigrants from Ireland (86.0%, a difference of 0.060%).
| Demographics | Rating | Rank | In Labor Force | Age 25-29 |
| Bulgarians | 100.0 /100 | #18 | Exceptional 86.0% |
| Cape Verdeans | 100.0 /100 | #19 | Exceptional 86.0% |
| Immigrants | Ireland | 100.0 /100 | #20 | Exceptional 86.0% |
| Maltese | 100.0 /100 | #21 | Exceptional 86.0% |
| Cambodians | 100.0 /100 | #22 | Exceptional 86.0% |
| Immigrants | Uganda | 100.0 /100 | #23 | Exceptional 86.0% |
| Immigrants | Eastern Africa | 100.0 /100 | #24 | Exceptional 86.0% |
| Sudanese | 100.0 /100 | #25 | Exceptional 85.9% |
| Immigrants | North Macedonia | 100.0 /100 | #26 | Exceptional 85.9% |
| Paraguayans | 100.0 /100 | #27 | Exceptional 85.9% |
| Ugandans | 100.0 /100 | #28 | Exceptional 85.9% |
| Immigrants | Liberia | 100.0 /100 | #29 | Exceptional 85.9% |
| Immigrants | Serbia | 100.0 /100 | #30 | Exceptional 85.9% |
| German Russians | 100.0 /100 | #31 | Exceptional 85.8% |
| Slovaks | 100.0 /100 | #32 | Exceptional 85.8% |