Icelander vs Iroquois Single Father Households
COMPARE
Icelander
Iroquois
Single Father Households
Single Father Households Comparison
Icelanders
Iroquois
2.3%
SINGLE FATHER HOUSEHOLDS
63.1/ 100
METRIC RATING
168th/ 347
METRIC RANK
2.6%
SINGLE FATHER HOUSEHOLDS
0.2/ 100
METRIC RATING
273rd/ 347
METRIC RANK
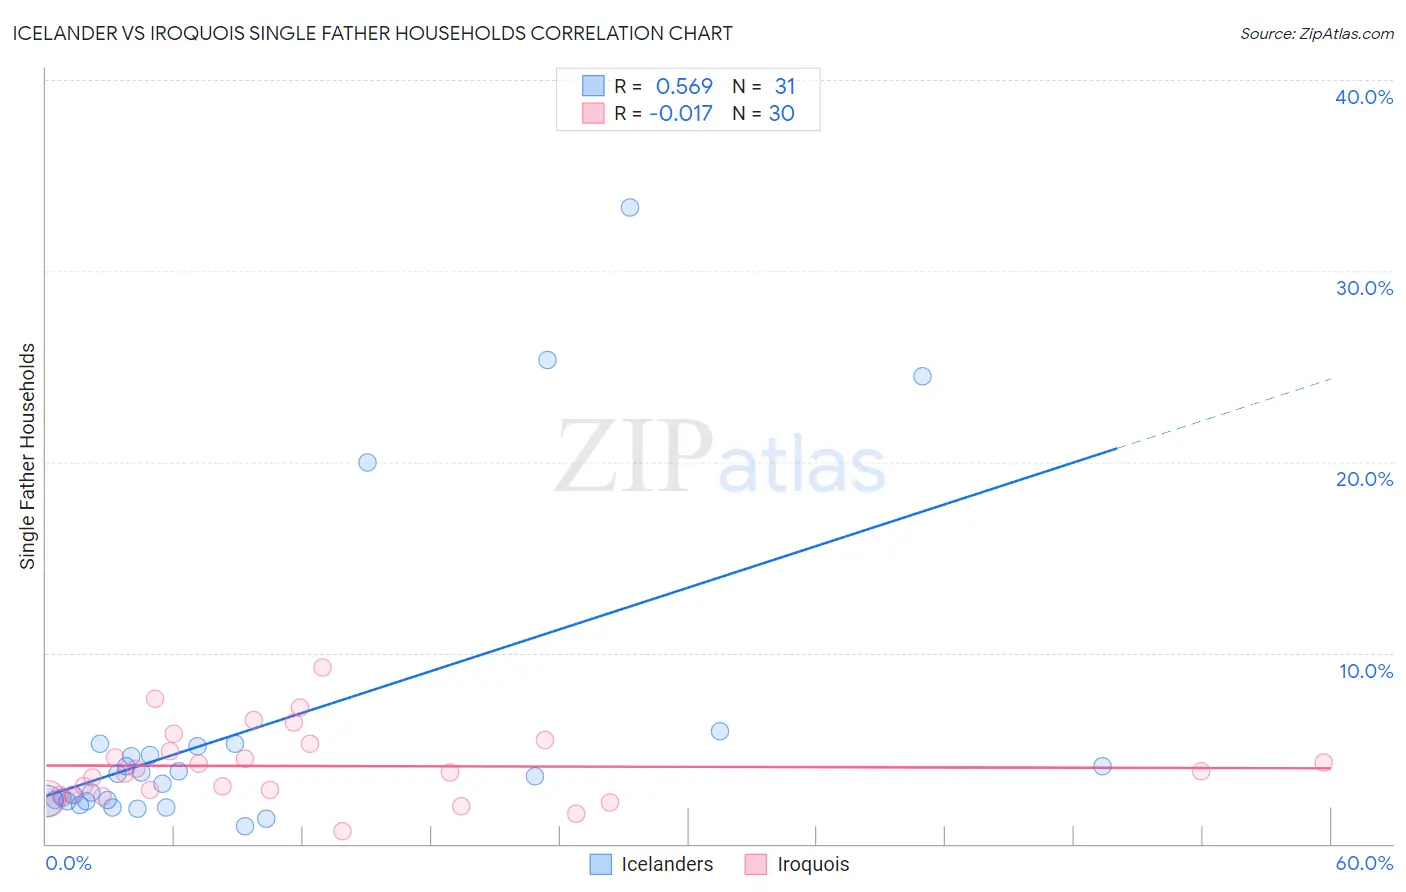
Icelander vs Iroquois Single Father Households Correlation Chart
The statistical analysis conducted on geographies consisting of 159,015,107 people shows a substantial positive correlation between the proportion of Icelanders and percentage of single father households in the United States with a correlation coefficient (R) of 0.569 and weighted average of 2.3%. Similarly, the statistical analysis conducted on geographies consisting of 206,362,821 people shows no correlation between the proportion of Iroquois and percentage of single father households in the United States with a correlation coefficient (R) of -0.017 and weighted average of 2.6%, a difference of 12.5%.
Single Father Households Correlation Summary
| Measurement | Icelander | Iroquois |
| Minimum | 0.94% | 0.63% |
| Maximum | 33.3% | 9.2% |
| Range | 32.4% | 8.6% |
| Mean | 6.1% | 4.1% |
| Median | 3.5% | 3.7% |
| Interquartile 25% (IQ1) | 2.2% | 2.5% |
| Interquartile 75% (IQ3) | 5.1% | 5.2% |
| Interquartile Range (IQR) | 2.9% | 2.7% |
| Standard Deviation (Sample) | 8.0% | 1.9% |
| Standard Deviation (Population) | 7.9% | 1.9% |
Similar Demographics by Single Father Households
Demographics Similar to Icelanders by Single Father Households
In terms of single father households, the demographic groups most similar to Icelanders are Czech (2.3%, a difference of 0.040%), Ugandan (2.3%, a difference of 0.070%), South American (2.3%, a difference of 0.10%), Swedish (2.3%, a difference of 0.12%), and Czechoslovakian (2.3%, a difference of 0.33%).
| Demographics | Rating | Rank | Single Father Households |
| Swiss | 73.2 /100 | #161 | Good 2.3% |
| Scottish | 72.8 /100 | #162 | Good 2.3% |
| Irish | 72.1 /100 | #163 | Good 2.3% |
| Pakistanis | 70.6 /100 | #164 | Good 2.3% |
| Scotch-Irish | 69.4 /100 | #165 | Good 2.3% |
| English | 68.6 /100 | #166 | Good 2.3% |
| South Americans | 64.3 /100 | #167 | Good 2.3% |
| Icelanders | 63.1 /100 | #168 | Good 2.3% |
| Czechs | 62.5 /100 | #169 | Good 2.3% |
| Ugandans | 62.2 /100 | #170 | Good 2.3% |
| Swedes | 61.6 /100 | #171 | Good 2.3% |
| Czechoslovakians | 58.9 /100 | #172 | Average 2.3% |
| Celtics | 55.4 /100 | #173 | Average 2.3% |
| Afghans | 50.0 /100 | #174 | Average 2.3% |
| Immigrants | Jamaica | 49.1 /100 | #175 | Average 2.3% |
Demographics Similar to Iroquois by Single Father Households
In terms of single father households, the demographic groups most similar to Iroquois are Puerto Rican (2.6%, a difference of 0.030%), Belizean (2.6%, a difference of 0.040%), Creek (2.6%, a difference of 0.050%), Seminole (2.6%, a difference of 0.41%), and Immigrants from Dominican Republic (2.6%, a difference of 0.45%).
| Demographics | Rating | Rank | Single Father Households |
| French American Indians | 0.5 /100 | #266 | Tragic 2.6% |
| Guamanians/Chamorros | 0.4 /100 | #267 | Tragic 2.6% |
| Haitians | 0.4 /100 | #268 | Tragic 2.6% |
| Cubans | 0.3 /100 | #269 | Tragic 2.6% |
| Seminole | 0.3 /100 | #270 | Tragic 2.6% |
| Creek | 0.2 /100 | #271 | Tragic 2.6% |
| Belizeans | 0.2 /100 | #272 | Tragic 2.6% |
| Iroquois | 0.2 /100 | #273 | Tragic 2.6% |
| Puerto Ricans | 0.2 /100 | #274 | Tragic 2.6% |
| Immigrants | Dominican Republic | 0.2 /100 | #275 | Tragic 2.6% |
| Immigrants | Haiti | 0.1 /100 | #276 | Tragic 2.6% |
| Shoshone | 0.1 /100 | #277 | Tragic 2.6% |
| Cherokee | 0.1 /100 | #278 | Tragic 2.6% |
| Samoans | 0.1 /100 | #279 | Tragic 2.6% |
| Immigrants | Portugal | 0.1 /100 | #280 | Tragic 2.6% |