Ethiopian vs Iroquois Single Father Households
COMPARE
Ethiopian
Iroquois
Single Father Households
Single Father Households Comparison
Ethiopians
Iroquois
2.4%
SINGLE FATHER HOUSEHOLDS
16.6/ 100
METRIC RATING
214th/ 347
METRIC RANK
2.6%
SINGLE FATHER HOUSEHOLDS
0.2/ 100
METRIC RATING
273rd/ 347
METRIC RANK
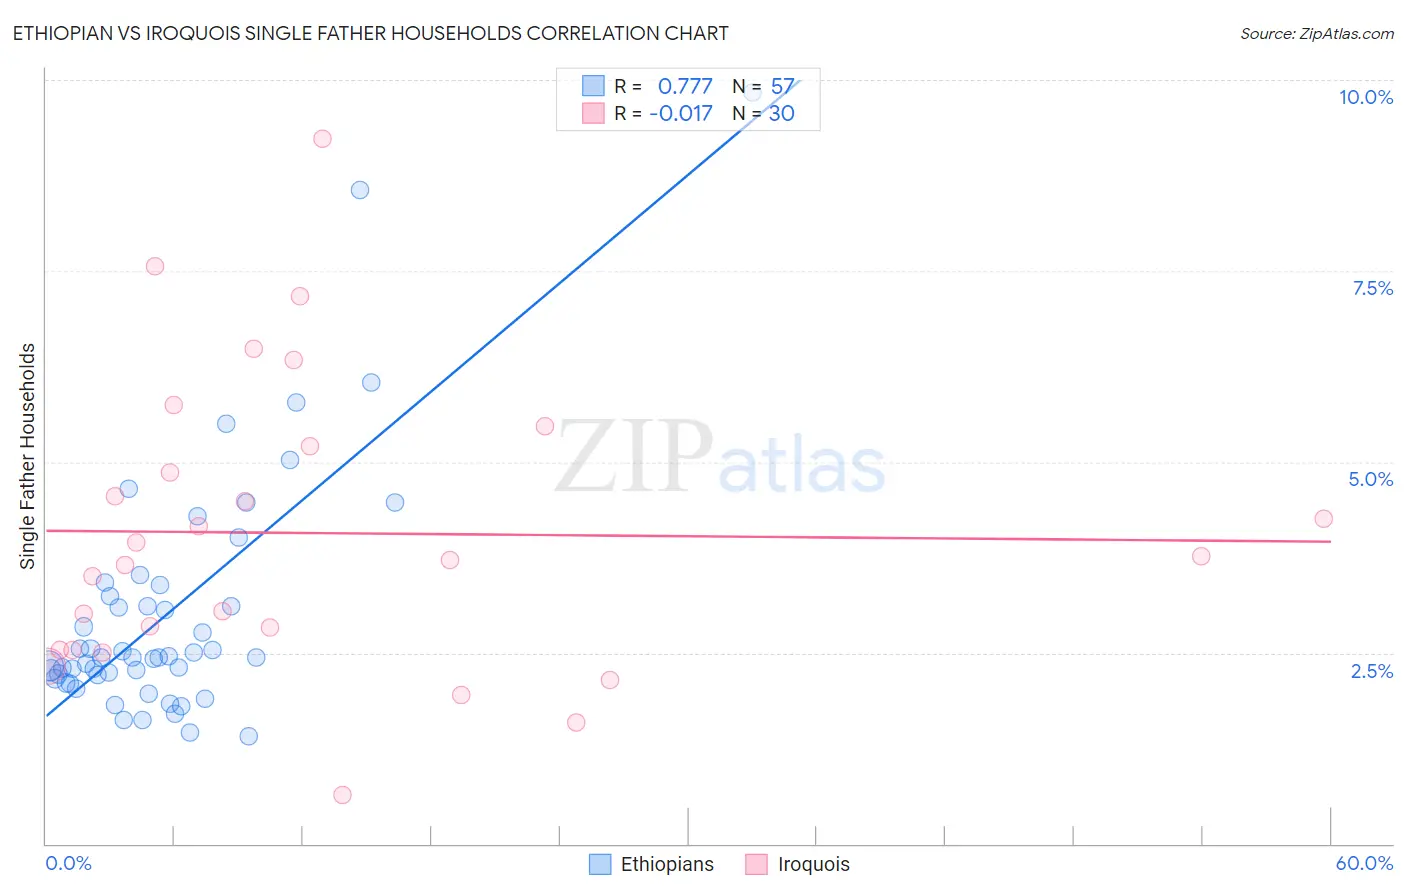
Ethiopian vs Iroquois Single Father Households Correlation Chart
The statistical analysis conducted on geographies consisting of 222,457,942 people shows a strong positive correlation between the proportion of Ethiopians and percentage of single father households in the United States with a correlation coefficient (R) of 0.777 and weighted average of 2.4%. Similarly, the statistical analysis conducted on geographies consisting of 206,362,821 people shows no correlation between the proportion of Iroquois and percentage of single father households in the United States with a correlation coefficient (R) of -0.017 and weighted average of 2.6%, a difference of 8.2%.
Single Father Households Correlation Summary
| Measurement | Ethiopian | Iroquois |
| Minimum | 1.4% | 0.63% |
| Maximum | 9.8% | 9.2% |
| Range | 8.4% | 8.6% |
| Mean | 3.0% | 4.1% |
| Median | 2.4% | 3.7% |
| Interquartile 25% (IQ1) | 2.2% | 2.5% |
| Interquartile 75% (IQ3) | 3.3% | 5.2% |
| Interquartile Range (IQR) | 1.1% | 2.7% |
| Standard Deviation (Sample) | 1.6% | 1.9% |
| Standard Deviation (Population) | 1.6% | 1.9% |
Similar Demographics by Single Father Households
Demographics Similar to Ethiopians by Single Father Households
In terms of single father households, the demographic groups most similar to Ethiopians are Norwegian (2.4%, a difference of 0.060%), Immigrants from South Eastern Asia (2.4%, a difference of 0.090%), Finnish (2.4%, a difference of 0.21%), Immigrants from Ecuador (2.4%, a difference of 0.23%), and Immigrants from Nigeria (2.4%, a difference of 0.26%).
| Demographics | Rating | Rank | Single Father Households |
| Whites/Caucasians | 22.6 /100 | #207 | Fair 2.4% |
| Immigrants | Kenya | 20.3 /100 | #208 | Fair 2.4% |
| Immigrants | Peru | 19.3 /100 | #209 | Poor 2.4% |
| Immigrants | Costa Rica | 19.2 /100 | #210 | Poor 2.4% |
| Immigrants | Nigeria | 18.7 /100 | #211 | Poor 2.4% |
| Finns | 18.3 /100 | #212 | Poor 2.4% |
| Norwegians | 17.1 /100 | #213 | Poor 2.4% |
| Ethiopians | 16.6 /100 | #214 | Poor 2.4% |
| Immigrants | South Eastern Asia | 15.9 /100 | #215 | Poor 2.4% |
| Immigrants | Ecuador | 14.9 /100 | #216 | Poor 2.4% |
| Dutch | 14.3 /100 | #217 | Poor 2.4% |
| Immigrants | Ethiopia | 13.4 /100 | #218 | Poor 2.4% |
| Sudanese | 13.0 /100 | #219 | Poor 2.4% |
| Ghanaians | 12.9 /100 | #220 | Poor 2.4% |
| Immigrants | Burma/Myanmar | 12.1 /100 | #221 | Poor 2.4% |
Demographics Similar to Iroquois by Single Father Households
In terms of single father households, the demographic groups most similar to Iroquois are Puerto Rican (2.6%, a difference of 0.030%), Belizean (2.6%, a difference of 0.040%), Creek (2.6%, a difference of 0.050%), Seminole (2.6%, a difference of 0.41%), and Immigrants from Dominican Republic (2.6%, a difference of 0.45%).
| Demographics | Rating | Rank | Single Father Households |
| French American Indians | 0.5 /100 | #266 | Tragic 2.6% |
| Guamanians/Chamorros | 0.4 /100 | #267 | Tragic 2.6% |
| Haitians | 0.4 /100 | #268 | Tragic 2.6% |
| Cubans | 0.3 /100 | #269 | Tragic 2.6% |
| Seminole | 0.3 /100 | #270 | Tragic 2.6% |
| Creek | 0.2 /100 | #271 | Tragic 2.6% |
| Belizeans | 0.2 /100 | #272 | Tragic 2.6% |
| Iroquois | 0.2 /100 | #273 | Tragic 2.6% |
| Puerto Ricans | 0.2 /100 | #274 | Tragic 2.6% |
| Immigrants | Dominican Republic | 0.2 /100 | #275 | Tragic 2.6% |
| Immigrants | Haiti | 0.1 /100 | #276 | Tragic 2.6% |
| Shoshone | 0.1 /100 | #277 | Tragic 2.6% |
| Cherokee | 0.1 /100 | #278 | Tragic 2.6% |
| Samoans | 0.1 /100 | #279 | Tragic 2.6% |
| Immigrants | Portugal | 0.1 /100 | #280 | Tragic 2.6% |