Icelander vs Immigrants from Honduras Married-couple Households
COMPARE
Icelander
Immigrants from Honduras
Married-couple Households
Married-couple Households Comparison
Icelanders
Immigrants from Honduras
47.0%
MARRIED-COUPLE HOUSEHOLDS
79.5/ 100
METRIC RATING
148th/ 347
METRIC RANK
41.6%
MARRIED-COUPLE HOUSEHOLDS
0.0/ 100
METRIC RATING
302nd/ 347
METRIC RANK
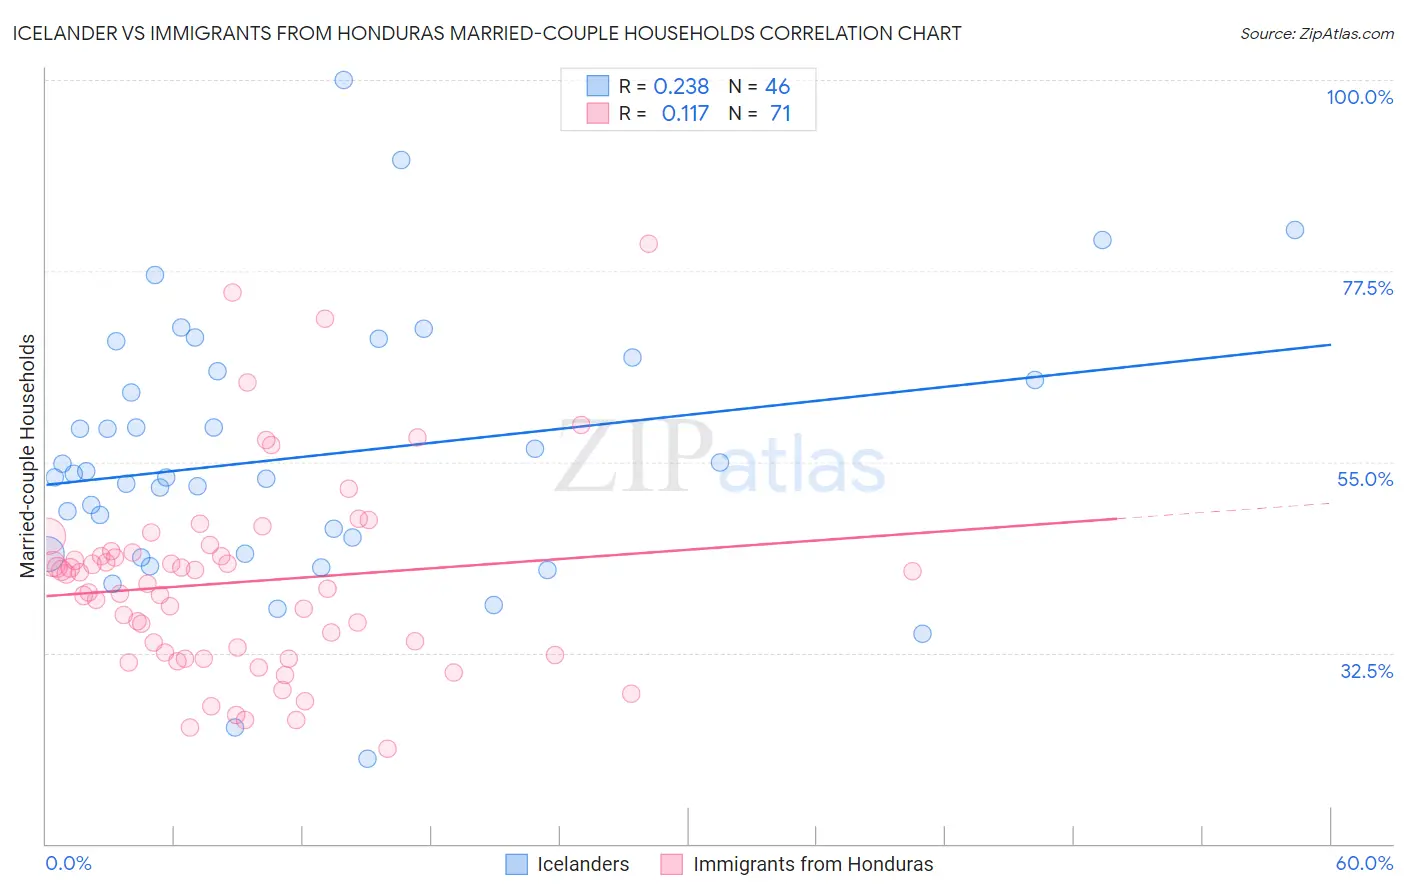
Icelander vs Immigrants from Honduras Married-couple Households Correlation Chart
The statistical analysis conducted on geographies consisting of 159,619,333 people shows a weak positive correlation between the proportion of Icelanders and percentage of married-couple family households in the United States with a correlation coefficient (R) of 0.238 and weighted average of 47.0%. Similarly, the statistical analysis conducted on geographies consisting of 322,465,433 people shows a poor positive correlation between the proportion of Immigrants from Honduras and percentage of married-couple family households in the United States with a correlation coefficient (R) of 0.117 and weighted average of 41.6%, a difference of 13.1%.
Married-couple Households Correlation Summary
| Measurement | Icelander | Immigrants from Honduras |
| Minimum | 20.0% | 21.2% |
| Maximum | 100.0% | 80.6% |
| Range | 80.0% | 59.5% |
| Mean | 55.7% | 40.8% |
| Median | 53.4% | 40.7% |
| Interquartile 25% (IQ1) | 44.1% | 32.3% |
| Interquartile 75% (IQ3) | 65.7% | 44.4% |
| Interquartile Range (IQR) | 21.5% | 12.1% |
| Standard Deviation (Sample) | 15.9% | 11.5% |
| Standard Deviation (Population) | 15.7% | 11.5% |
Similar Demographics by Married-couple Households
Demographics Similar to Icelanders by Married-couple Households
In terms of married-couple households, the demographic groups most similar to Icelanders are Paraguayan (47.0%, a difference of 0.050%), Immigrants from Russia (47.0%, a difference of 0.10%), Immigrants from Syria (47.1%, a difference of 0.12%), Slovene (47.1%, a difference of 0.13%), and Immigrants from Western Europe (47.1%, a difference of 0.13%).
| Demographics | Rating | Rank | Married-couple Households |
| Costa Ricans | 84.4 /100 | #141 | Excellent 47.2% |
| Spaniards | 84.1 /100 | #142 | Excellent 47.2% |
| Immigrants | Belarus | 83.8 /100 | #143 | Excellent 47.2% |
| Mexicans | 83.4 /100 | #144 | Excellent 47.1% |
| Slovenes | 81.7 /100 | #145 | Excellent 47.1% |
| Immigrants | Western Europe | 81.6 /100 | #146 | Excellent 47.1% |
| Immigrants | Syria | 81.6 /100 | #147 | Excellent 47.1% |
| Icelanders | 79.5 /100 | #148 | Good 47.0% |
| Paraguayans | 78.7 /100 | #149 | Good 47.0% |
| Immigrants | Russia | 77.6 /100 | #150 | Good 47.0% |
| Immigrants | Bulgaria | 76.8 /100 | #151 | Good 47.0% |
| Serbians | 76.3 /100 | #152 | Good 47.0% |
| Hmong | 76.2 /100 | #153 | Good 47.0% |
| Immigrants | Western Asia | 76.1 /100 | #154 | Good 46.9% |
| Arabs | 76.0 /100 | #155 | Good 46.9% |
Demographics Similar to Immigrants from Honduras by Married-couple Households
In terms of married-couple households, the demographic groups most similar to Immigrants from Honduras are Subsaharan African (41.6%, a difference of 0.0%), Immigrants from Guyana (41.6%, a difference of 0.12%), Immigrants from Bahamas (41.7%, a difference of 0.17%), Sioux (41.5%, a difference of 0.23%), and Immigrants from Belize (41.8%, a difference of 0.38%).
| Demographics | Rating | Rank | Married-couple Households |
| Kiowa | 0.0 /100 | #295 | Tragic 42.0% |
| Immigrants | Sudan | 0.0 /100 | #296 | Tragic 41.9% |
| Arapaho | 0.0 /100 | #297 | Tragic 41.8% |
| Immigrants | Middle Africa | 0.0 /100 | #298 | Tragic 41.8% |
| Immigrants | Ghana | 0.0 /100 | #299 | Tragic 41.8% |
| Immigrants | Belize | 0.0 /100 | #300 | Tragic 41.8% |
| Immigrants | Bahamas | 0.0 /100 | #301 | Tragic 41.7% |
| Immigrants | Honduras | 0.0 /100 | #302 | Tragic 41.6% |
| Sub-Saharan Africans | 0.0 /100 | #303 | Tragic 41.6% |
| Immigrants | Guyana | 0.0 /100 | #304 | Tragic 41.6% |
| Sioux | 0.0 /100 | #305 | Tragic 41.5% |
| Guyanese | 0.0 /100 | #306 | Tragic 41.4% |
| Immigrants | Western Africa | 0.0 /100 | #307 | Tragic 41.4% |
| Crow | 0.0 /100 | #308 | Tragic 41.4% |
| Immigrants | Trinidad and Tobago | 0.0 /100 | #309 | Tragic 41.2% |