Icelander vs Immigrants from Chile 11th Grade
COMPARE
Icelander
Immigrants from Chile
11th Grade
11th Grade Comparison
Icelanders
Immigrants from Chile
93.6%
11TH GRADE
99.3/ 100
METRIC RATING
83rd/ 347
METRIC RANK
92.4%
11TH GRADE
33.3/ 100
METRIC RATING
189th/ 347
METRIC RANK
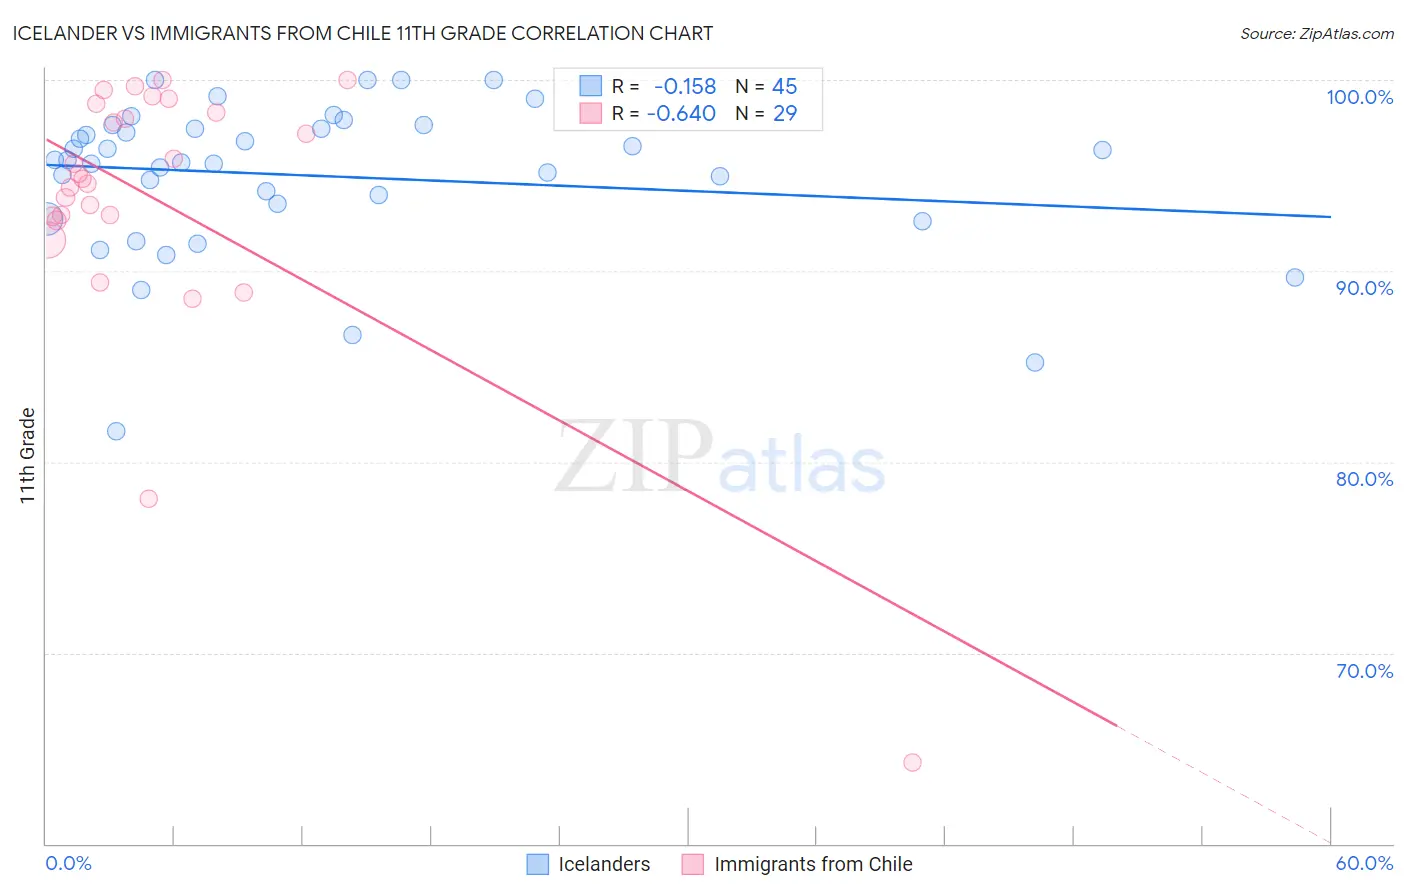
Icelander vs Immigrants from Chile 11th Grade Correlation Chart
The statistical analysis conducted on geographies consisting of 159,668,816 people shows a poor negative correlation between the proportion of Icelanders and percentage of population with at least 11th grade education in the United States with a correlation coefficient (R) of -0.158 and weighted average of 93.6%. Similarly, the statistical analysis conducted on geographies consisting of 218,647,266 people shows a significant negative correlation between the proportion of Immigrants from Chile and percentage of population with at least 11th grade education in the United States with a correlation coefficient (R) of -0.640 and weighted average of 92.4%, a difference of 1.4%.
11th Grade Correlation Summary
| Measurement | Icelander | Immigrants from Chile |
| Minimum | 81.6% | 64.3% |
| Maximum | 100.0% | 100.0% |
| Range | 18.4% | 35.7% |
| Mean | 95.0% | 93.7% |
| Median | 95.8% | 94.8% |
| Interquartile 25% (IQ1) | 93.1% | 92.8% |
| Interquartile 75% (IQ3) | 97.5% | 98.5% |
| Interquartile Range (IQR) | 4.4% | 5.8% |
| Standard Deviation (Sample) | 4.0% | 7.3% |
| Standard Deviation (Population) | 3.9% | 7.2% |
Similar Demographics by 11th Grade
Demographics Similar to Icelanders by 11th Grade
In terms of 11th grade, the demographic groups most similar to Icelanders are Immigrants from Taiwan (93.6%, a difference of 0.0%), Immigrants from Saudi Arabia (93.7%, a difference of 0.010%), Immigrants from Switzerland (93.6%, a difference of 0.010%), Immigrants from South Central Asia (93.6%, a difference of 0.010%), and Immigrants from Western Europe (93.6%, a difference of 0.020%).
| Demographics | Rating | Rank | 11th Grade |
| Celtics | 99.5 /100 | #76 | Exceptional 93.7% |
| Aleuts | 99.5 /100 | #77 | Exceptional 93.7% |
| Soviet Union | 99.5 /100 | #78 | Exceptional 93.7% |
| Immigrants | Denmark | 99.5 /100 | #79 | Exceptional 93.7% |
| Canadians | 99.5 /100 | #80 | Exceptional 93.7% |
| Immigrants | Moldova | 99.5 /100 | #81 | Exceptional 93.7% |
| Immigrants | Saudi Arabia | 99.3 /100 | #82 | Exceptional 93.7% |
| Icelanders | 99.3 /100 | #83 | Exceptional 93.6% |
| Immigrants | Taiwan | 99.3 /100 | #84 | Exceptional 93.6% |
| Immigrants | Switzerland | 99.3 /100 | #85 | Exceptional 93.6% |
| Immigrants | South Central Asia | 99.2 /100 | #86 | Exceptional 93.6% |
| Immigrants | Western Europe | 99.2 /100 | #87 | Exceptional 93.6% |
| Cambodians | 99.2 /100 | #88 | Exceptional 93.6% |
| Burmese | 99.2 /100 | #89 | Exceptional 93.6% |
| Ottawa | 99.2 /100 | #90 | Exceptional 93.6% |
Demographics Similar to Immigrants from Chile by 11th Grade
In terms of 11th grade, the demographic groups most similar to Immigrants from Chile are Immigrants from Indonesia (92.4%, a difference of 0.0%), Arapaho (92.4%, a difference of 0.020%), Immigrants from Western Asia (92.4%, a difference of 0.020%), Chickasaw (92.3%, a difference of 0.020%), and Immigrants from Nepal (92.4%, a difference of 0.030%).
| Demographics | Rating | Rank | 11th Grade |
| Immigrants | Morocco | 38.6 /100 | #182 | Fair 92.4% |
| Immigrants | Malaysia | 37.6 /100 | #183 | Fair 92.4% |
| Immigrants | Asia | 37.4 /100 | #184 | Fair 92.4% |
| Immigrants | Nepal | 36.4 /100 | #185 | Fair 92.4% |
| Arapaho | 35.1 /100 | #186 | Fair 92.4% |
| Immigrants | Western Asia | 35.0 /100 | #187 | Fair 92.4% |
| Immigrants | Indonesia | 33.7 /100 | #188 | Fair 92.4% |
| Immigrants | Chile | 33.3 /100 | #189 | Fair 92.4% |
| Chickasaw | 31.4 /100 | #190 | Fair 92.3% |
| French American Indians | 30.8 /100 | #191 | Fair 92.3% |
| Immigrants | Syria | 30.4 /100 | #192 | Fair 92.3% |
| Moroccans | 28.7 /100 | #193 | Fair 92.3% |
| Sioux | 28.5 /100 | #194 | Fair 92.3% |
| Liberians | 26.8 /100 | #195 | Fair 92.3% |
| Panamanians | 26.4 /100 | #196 | Fair 92.3% |