Hungarian vs Dutch Married-couple Households
COMPARE
Hungarian
Dutch
Married-couple Households
Married-couple Households Comparison
Hungarians
Dutch
49.1%
MARRIED-COUPLE HOUSEHOLDS
99.8/ 100
METRIC RATING
32nd/ 347
METRIC RANK
49.5%
MARRIED-COUPLE HOUSEHOLDS
99.9/ 100
METRIC RATING
23rd/ 347
METRIC RANK
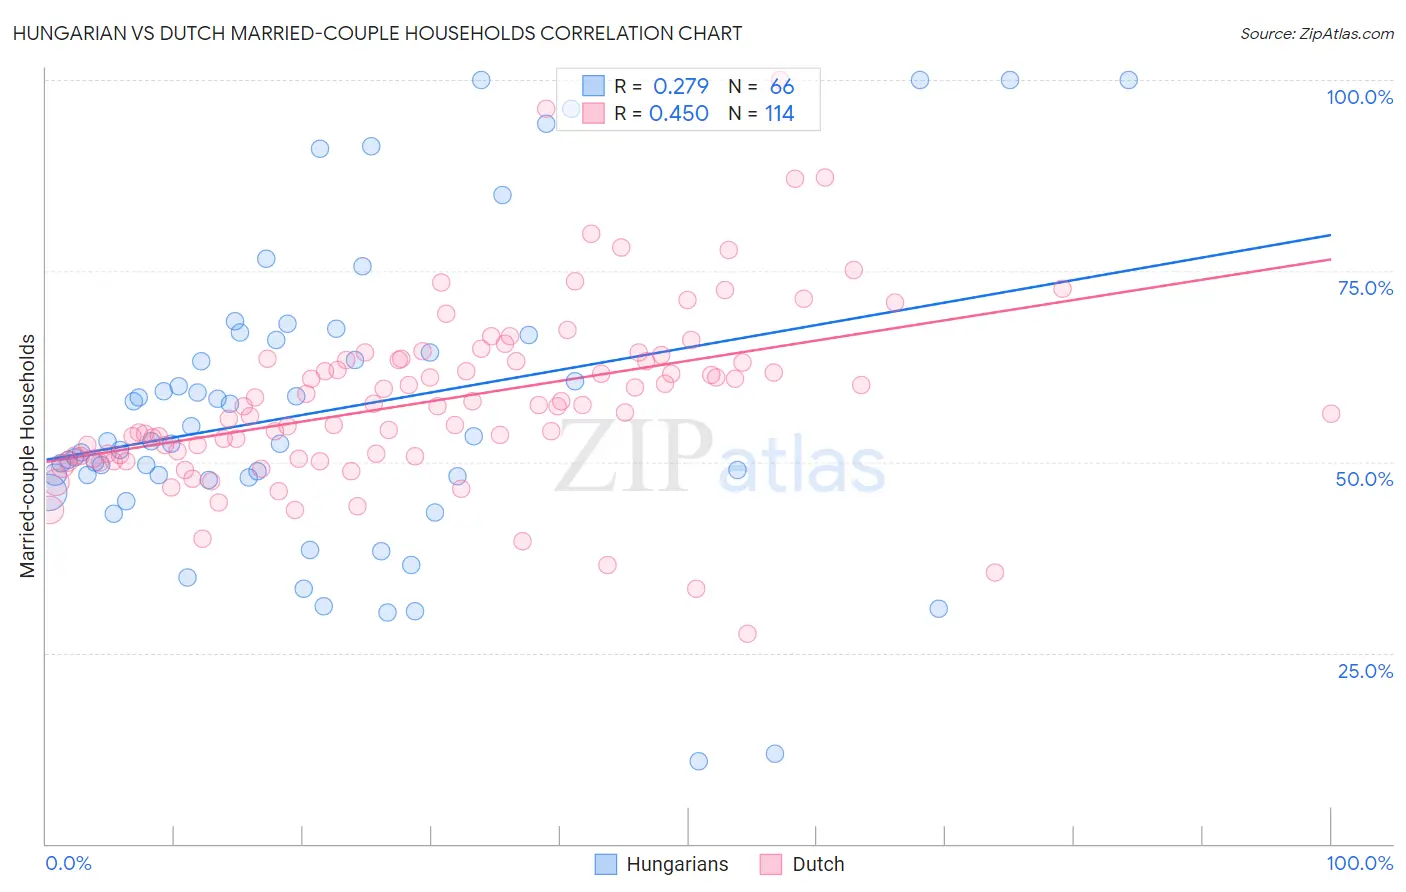
Hungarian vs Dutch Married-couple Households Correlation Chart
The statistical analysis conducted on geographies consisting of 485,875,006 people shows a weak positive correlation between the proportion of Hungarians and percentage of married-couple family households in the United States with a correlation coefficient (R) of 0.279 and weighted average of 49.1%. Similarly, the statistical analysis conducted on geographies consisting of 553,839,750 people shows a moderate positive correlation between the proportion of Dutch and percentage of married-couple family households in the United States with a correlation coefficient (R) of 0.450 and weighted average of 49.5%, a difference of 0.80%.
Married-couple Households Correlation Summary
| Measurement | Hungarian | Dutch |
| Minimum | 10.9% | 27.5% |
| Maximum | 100.0% | 100.0% |
| Range | 89.1% | 72.5% |
| Mean | 56.7% | 58.0% |
| Median | 52.5% | 57.3% |
| Interquartile 25% (IQ1) | 47.9% | 50.8% |
| Interquartile 75% (IQ3) | 65.9% | 63.3% |
| Interquartile Range (IQR) | 18.0% | 12.5% |
| Standard Deviation (Sample) | 19.9% | 11.6% |
| Standard Deviation (Population) | 19.8% | 11.5% |
Demographics Similar to Hungarians and Dutch by Married-couple Households
In terms of married-couple households, the demographic groups most similar to Hungarians are Immigrants from Asia (49.1%, a difference of 0.030%), Native Hawaiian (49.1%, a difference of 0.060%), Italian (49.0%, a difference of 0.11%), Scottish (49.0%, a difference of 0.13%), and Bolivian (49.2%, a difference of 0.17%). Similarly, the demographic groups most similar to Dutch are Asian (49.5%, a difference of 0.010%), Czech (49.4%, a difference of 0.080%), Norwegian (49.5%, a difference of 0.12%), European (49.6%, a difference of 0.18%), and Scandinavian (49.6%, a difference of 0.18%).
| Demographics | Rating | Rank | Married-couple Households |
| Immigrants | Hong Kong | 99.9 /100 | #17 | Exceptional 49.6% |
| English | 99.9 /100 | #18 | Exceptional 49.6% |
| Europeans | 99.9 /100 | #19 | Exceptional 49.6% |
| Scandinavians | 99.9 /100 | #20 | Exceptional 49.6% |
| Norwegians | 99.9 /100 | #21 | Exceptional 49.5% |
| Asians | 99.9 /100 | #22 | Exceptional 49.5% |
| Dutch | 99.9 /100 | #23 | Exceptional 49.5% |
| Czechs | 99.9 /100 | #24 | Exceptional 49.4% |
| Immigrants | Philippines | 99.9 /100 | #25 | Exceptional 49.3% |
| Immigrants | Scotland | 99.8 /100 | #26 | Exceptional 49.3% |
| Bhutanese | 99.8 /100 | #27 | Exceptional 49.3% |
| Germans | 99.8 /100 | #28 | Exceptional 49.2% |
| Maltese | 99.8 /100 | #29 | Exceptional 49.2% |
| Bolivians | 99.8 /100 | #30 | Exceptional 49.2% |
| Native Hawaiians | 99.8 /100 | #31 | Exceptional 49.1% |
| Hungarians | 99.8 /100 | #32 | Exceptional 49.1% |
| Immigrants | Asia | 99.7 /100 | #33 | Exceptional 49.1% |
| Italians | 99.7 /100 | #34 | Exceptional 49.0% |
| Scottish | 99.7 /100 | #35 | Exceptional 49.0% |
| Iranians | 99.7 /100 | #36 | Exceptional 49.0% |
| Sri Lankans | 99.7 /100 | #37 | Exceptional 49.0% |