Hmong vs Immigrants from West Indies 7th Grade
COMPARE
Hmong
Immigrants from West Indies
7th Grade
7th Grade Comparison
Hmong
Immigrants from West Indies
96.4%
7TH GRADE
91.5/ 100
METRIC RATING
133rd/ 347
METRIC RANK
94.8%
7TH GRADE
0.0/ 100
METRIC RATING
292nd/ 347
METRIC RANK
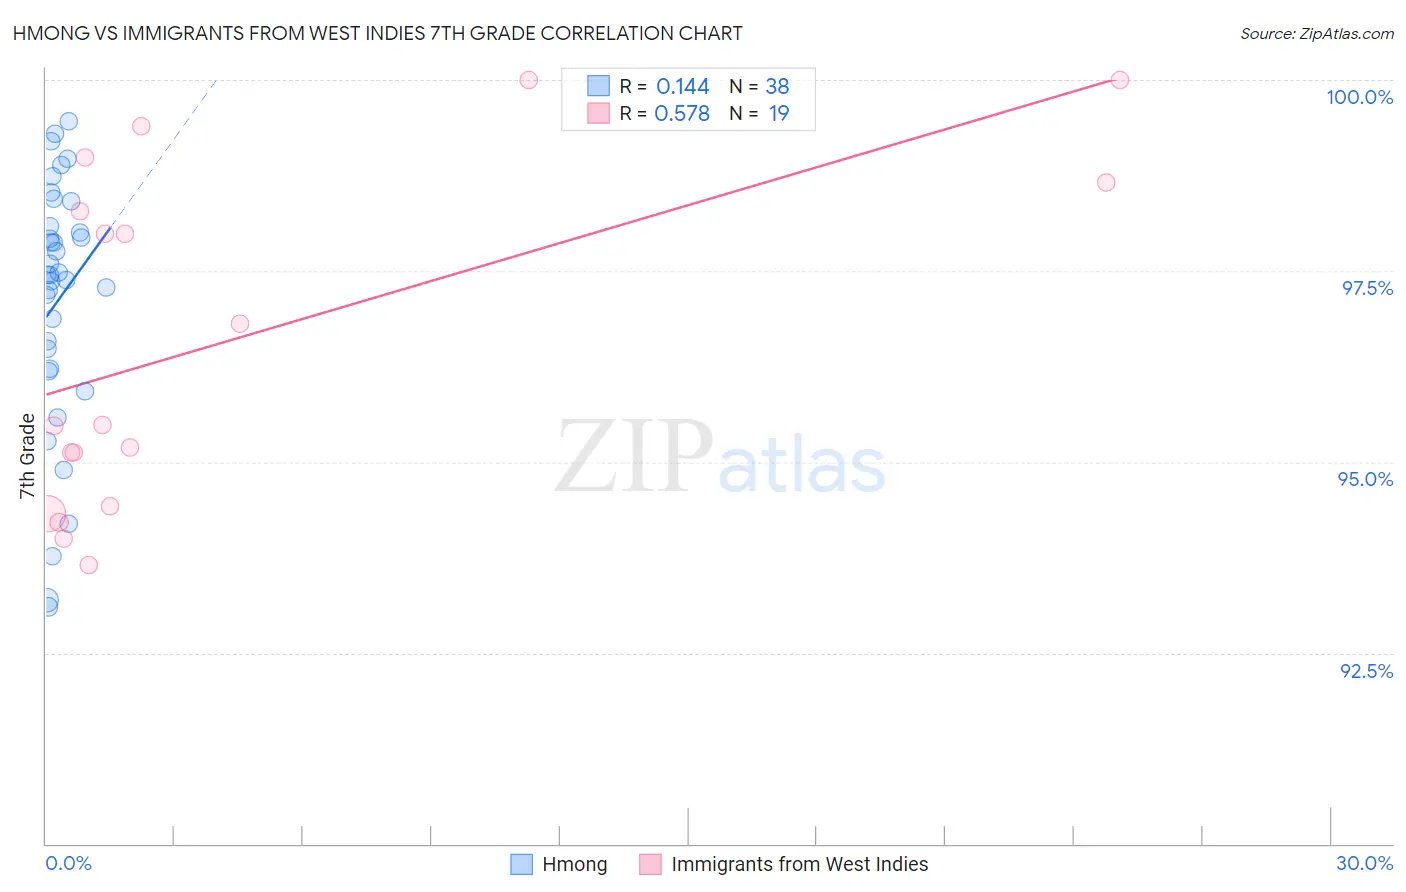
Hmong vs Immigrants from West Indies 7th Grade Correlation Chart
The statistical analysis conducted on geographies consisting of 24,672,093 people shows a poor positive correlation between the proportion of Hmong and percentage of population with at least 7th grade education in the United States with a correlation coefficient (R) of 0.144 and weighted average of 96.4%. Similarly, the statistical analysis conducted on geographies consisting of 72,457,514 people shows a substantial positive correlation between the proportion of Immigrants from West Indies and percentage of population with at least 7th grade education in the United States with a correlation coefficient (R) of 0.578 and weighted average of 94.8%, a difference of 1.7%.
7th Grade Correlation Summary
| Measurement | Hmong | Immigrants from West Indies |
| Minimum | 93.1% | 93.7% |
| Maximum | 99.5% | 100.0% |
| Range | 6.4% | 6.3% |
| Mean | 97.1% | 96.6% |
| Median | 97.4% | 95.5% |
| Interquartile 25% (IQ1) | 96.2% | 94.4% |
| Interquartile 75% (IQ3) | 98.1% | 98.7% |
| Interquartile Range (IQR) | 1.9% | 4.2% |
| Standard Deviation (Sample) | 1.6% | 2.2% |
| Standard Deviation (Population) | 1.6% | 2.1% |
Similar Demographics by 7th Grade
Demographics Similar to Hmong by 7th Grade
In terms of 7th grade, the demographic groups most similar to Hmong are Filipino (96.4%, a difference of 0.010%), Colville (96.4%, a difference of 0.010%), Soviet Union (96.4%, a difference of 0.010%), Immigrants from Kuwait (96.4%, a difference of 0.010%), and Immigrants from Hungary (96.4%, a difference of 0.020%).
| Demographics | Rating | Rank | 7th Grade |
| Palestinians | 93.5 /100 | #126 | Exceptional 96.4% |
| Immigrants | Bosnia and Herzegovina | 93.3 /100 | #127 | Exceptional 96.4% |
| Immigrants | Romania | 93.2 /100 | #128 | Exceptional 96.4% |
| Immigrants | North Macedonia | 93.1 /100 | #129 | Exceptional 96.4% |
| Immigrants | Serbia | 92.8 /100 | #130 | Exceptional 96.4% |
| Filipinos | 92.1 /100 | #131 | Exceptional 96.4% |
| Colville | 91.7 /100 | #132 | Exceptional 96.4% |
| Hmong | 91.5 /100 | #133 | Exceptional 96.4% |
| Soviet Union | 91.2 /100 | #134 | Exceptional 96.4% |
| Immigrants | Kuwait | 91.1 /100 | #135 | Exceptional 96.4% |
| Immigrants | Hungary | 90.6 /100 | #136 | Exceptional 96.4% |
| Immigrants | Turkey | 90.2 /100 | #137 | Exceptional 96.4% |
| Jordanians | 90.0 /100 | #138 | Excellent 96.4% |
| Basques | 89.3 /100 | #139 | Excellent 96.4% |
| Cambodians | 88.3 /100 | #140 | Excellent 96.3% |
Demographics Similar to Immigrants from West Indies by 7th Grade
In terms of 7th grade, the demographic groups most similar to Immigrants from West Indies are Immigrants from Grenada (94.8%, a difference of 0.020%), Fijian (94.7%, a difference of 0.020%), Malaysian (94.8%, a difference of 0.060%), Taiwanese (94.8%, a difference of 0.080%), and British West Indian (94.8%, a difference of 0.090%).
| Demographics | Rating | Rank | 7th Grade |
| Immigrants | Eritrea | 0.1 /100 | #285 | Tragic 94.9% |
| Immigrants | Philippines | 0.0 /100 | #286 | Tragic 94.9% |
| Immigrants | Peru | 0.0 /100 | #287 | Tragic 94.9% |
| British West Indians | 0.0 /100 | #288 | Tragic 94.8% |
| Taiwanese | 0.0 /100 | #289 | Tragic 94.8% |
| Malaysians | 0.0 /100 | #290 | Tragic 94.8% |
| Immigrants | Grenada | 0.0 /100 | #291 | Tragic 94.8% |
| Immigrants | West Indies | 0.0 /100 | #292 | Tragic 94.8% |
| Fijians | 0.0 /100 | #293 | Tragic 94.7% |
| Haitians | 0.0 /100 | #294 | Tragic 94.7% |
| Yaqui | 0.0 /100 | #295 | Tragic 94.6% |
| Cubans | 0.0 /100 | #296 | Tragic 94.6% |
| Immigrants | South Eastern Asia | 0.0 /100 | #297 | Tragic 94.5% |
| Indonesians | 0.0 /100 | #298 | Tragic 94.5% |
| Bangladeshis | 0.0 /100 | #299 | Tragic 94.5% |