Marshallese vs Immigrants from West Indies Single Mother Households
COMPARE
Marshallese
Immigrants from West Indies
Single Mother Households
Single Mother Households Comparison
Marshallese
Immigrants from West Indies
6.3%
SINGLE MOTHER HOUSEHOLDS
45.8/ 100
METRIC RATING
175th/ 347
METRIC RANK
7.9%
SINGLE MOTHER HOUSEHOLDS
0.0/ 100
METRIC RATING
298th/ 347
METRIC RANK
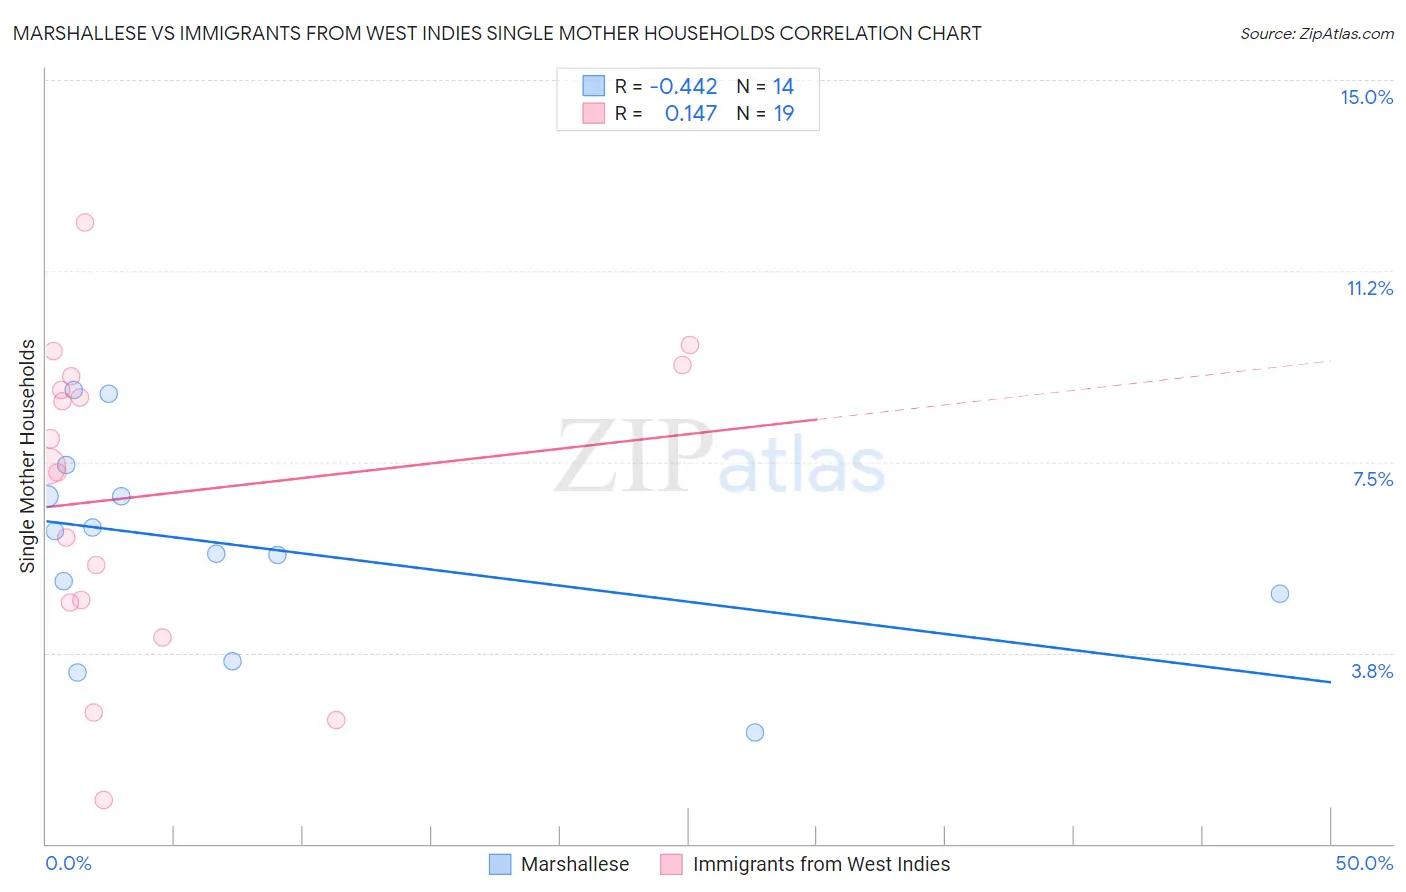
Marshallese vs Immigrants from West Indies Single Mother Households Correlation Chart
The statistical analysis conducted on geographies consisting of 14,758,592 people shows a moderate negative correlation between the proportion of Marshallese and percentage of single mother households in the United States with a correlation coefficient (R) of -0.442 and weighted average of 6.3%. Similarly, the statistical analysis conducted on geographies consisting of 72,447,708 people shows a poor positive correlation between the proportion of Immigrants from West Indies and percentage of single mother households in the United States with a correlation coefficient (R) of 0.147 and weighted average of 7.9%, a difference of 24.9%.
Single Mother Households Correlation Summary
| Measurement | Marshallese | Immigrants from West Indies |
| Minimum | 2.2% | 0.85% |
| Maximum | 8.9% | 12.2% |
| Range | 6.7% | 11.4% |
| Mean | 5.8% | 6.9% |
| Median | 5.9% | 7.4% |
| Interquartile 25% (IQ1) | 4.9% | 4.7% |
| Interquartile 75% (IQ3) | 6.8% | 9.2% |
| Interquartile Range (IQR) | 1.9% | 4.4% |
| Standard Deviation (Sample) | 1.9% | 3.0% |
| Standard Deviation (Population) | 1.9% | 2.9% |
Similar Demographics by Single Mother Households
Demographics Similar to Marshallese by Single Mother Households
In terms of single mother households, the demographic groups most similar to Marshallese are Immigrants from Bosnia and Herzegovina (6.3%, a difference of 0.16%), Osage (6.4%, a difference of 0.30%), Immigrants from Morocco (6.3%, a difference of 0.46%), Immigrants from Vietnam (6.3%, a difference of 0.63%), and Portuguese (6.4%, a difference of 0.65%).
| Demographics | Rating | Rank | Single Mother Households |
| Immigrants | Chile | 58.3 /100 | #168 | Average 6.3% |
| Puget Sound Salish | 58.1 /100 | #169 | Average 6.3% |
| Immigrants | Oceania | 54.6 /100 | #170 | Average 6.3% |
| Afghans | 52.5 /100 | #171 | Average 6.3% |
| Immigrants | South Eastern Asia | 52.2 /100 | #172 | Average 6.3% |
| Immigrants | Vietnam | 51.5 /100 | #173 | Average 6.3% |
| Immigrants | Morocco | 50.0 /100 | #174 | Average 6.3% |
| Marshallese | 45.8 /100 | #175 | Average 6.3% |
| Immigrants | Bosnia and Herzegovina | 44.3 /100 | #176 | Average 6.3% |
| Osage | 43.0 /100 | #177 | Average 6.4% |
| Portuguese | 40.0 /100 | #178 | Fair 6.4% |
| Hmong | 39.8 /100 | #179 | Fair 6.4% |
| Immigrants | Nepal | 36.1 /100 | #180 | Fair 6.4% |
| Spanish | 33.4 /100 | #181 | Fair 6.4% |
| South American Indians | 33.4 /100 | #182 | Fair 6.4% |
Demographics Similar to Immigrants from West Indies by Single Mother Households
In terms of single mother households, the demographic groups most similar to Immigrants from West Indies are Houma (7.9%, a difference of 0.080%), Hispanic or Latino (7.9%, a difference of 0.11%), Immigrants from Latin America (7.9%, a difference of 0.15%), Barbadian (7.9%, a difference of 0.22%), and Apache (7.9%, a difference of 0.51%).
| Demographics | Rating | Rank | Single Mother Households |
| West Indians | 0.0 /100 | #291 | Tragic 7.8% |
| Ghanaians | 0.0 /100 | #292 | Tragic 7.8% |
| Immigrants | Cameroon | 0.0 /100 | #293 | Tragic 7.9% |
| Apache | 0.0 /100 | #294 | Tragic 7.9% |
| Barbadians | 0.0 /100 | #295 | Tragic 7.9% |
| Immigrants | Latin America | 0.0 /100 | #296 | Tragic 7.9% |
| Hispanics or Latinos | 0.0 /100 | #297 | Tragic 7.9% |
| Immigrants | West Indies | 0.0 /100 | #298 | Tragic 7.9% |
| Houma | 0.0 /100 | #299 | Tragic 7.9% |
| Mexicans | 0.0 /100 | #300 | Tragic 8.0% |
| Chippewa | 0.0 /100 | #301 | Tragic 8.0% |
| Immigrants | Ghana | 0.0 /100 | #302 | Tragic 8.0% |
| Immigrants | Bahamas | 0.0 /100 | #303 | Tragic 8.0% |
| Natives/Alaskans | 0.0 /100 | #304 | Tragic 8.0% |
| Colville | 0.0 /100 | #305 | Tragic 8.0% |