Hawaiian vs Immigrants from North Macedonia Average Family Size
COMPARE
Hawaiian
Immigrants from North Macedonia
Average Family Size
Average Family Size Comparison
Hawaiians
Immigrants from North Macedonia
3.41
AVERAGE FAMILY SIZE
100.0/ 100
METRIC RATING
33rd/ 347
METRIC RANK
3.16
AVERAGE FAMILY SIZE
1.3/ 100
METRIC RATING
261st/ 347
METRIC RANK
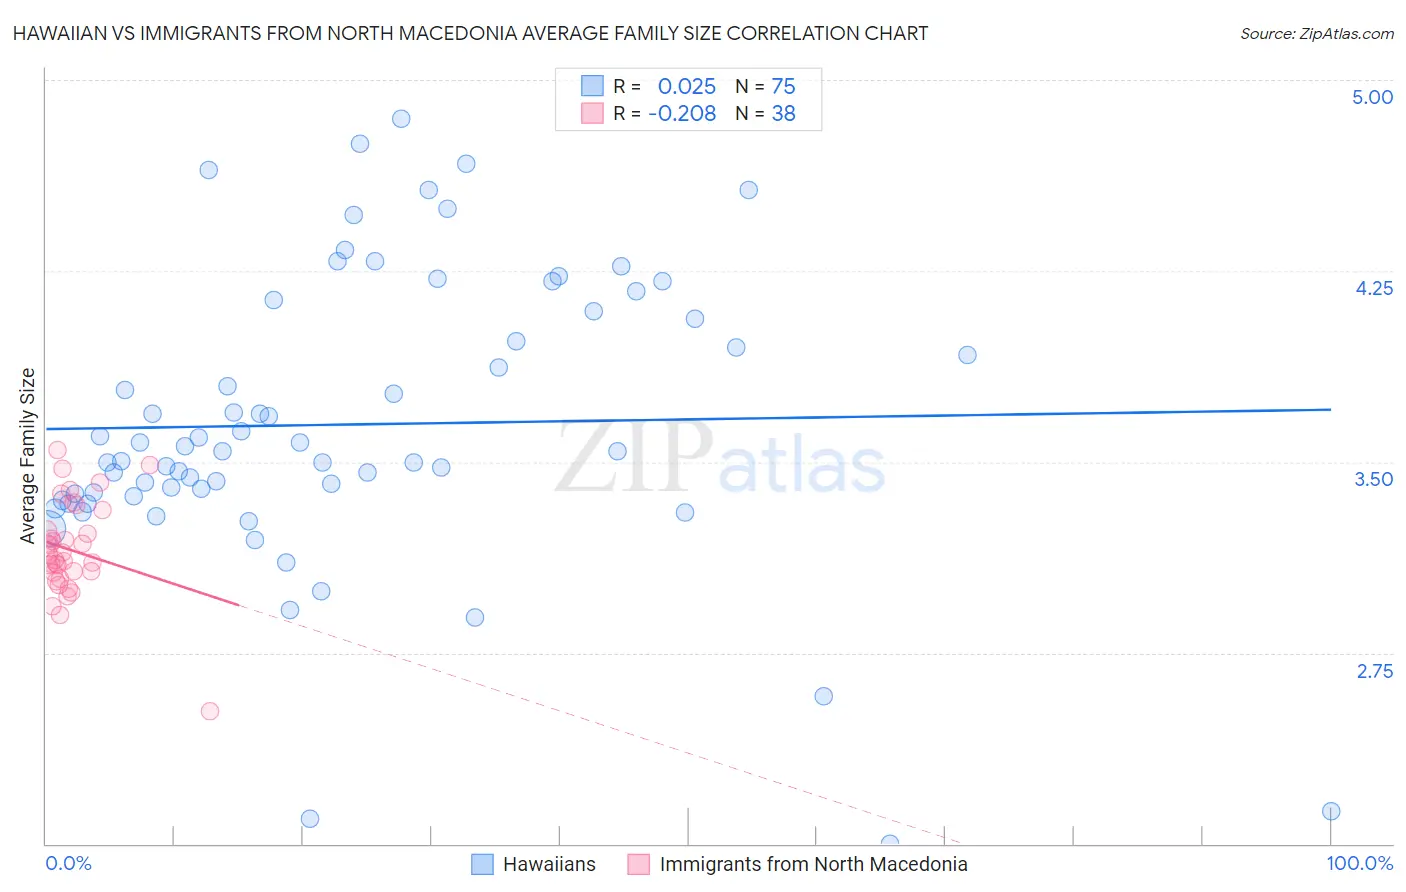
Hawaiian vs Immigrants from North Macedonia Average Family Size Correlation Chart
The statistical analysis conducted on geographies consisting of 327,392,742 people shows no correlation between the proportion of Hawaiians and average family size in the United States with a correlation coefficient (R) of 0.025 and weighted average of 3.41. Similarly, the statistical analysis conducted on geographies consisting of 74,306,697 people shows a weak negative correlation between the proportion of Immigrants from North Macedonia and average family size in the United States with a correlation coefficient (R) of -0.208 and weighted average of 3.16, a difference of 7.7%.
Average Family Size Correlation Summary
| Measurement | Hawaiian | Immigrants from North Macedonia |
| Minimum | 2.00 | 2.52 |
| Maximum | 4.85 | 3.55 |
| Range | 2.85 | 1.03 |
| Mean | 3.65 | 3.15 |
| Median | 3.54 | 3.13 |
| Interquartile 25% (IQ1) | 3.37 | 3.07 |
| Interquartile 75% (IQ3) | 4.09 | 3.23 |
| Interquartile Range (IQR) | 0.72 | 0.16 |
| Standard Deviation (Sample) | 0.58 | 0.19 |
| Standard Deviation (Population) | 0.57 | 0.19 |
Similar Demographics by Average Family Size
Demographics Similar to Hawaiians by Average Family Size
In terms of average family size, the demographic groups most similar to Hawaiians are Immigrants from Guatemala (3.41, a difference of 0.030%), Hispanic or Latino (3.41, a difference of 0.050%), Central American (3.41, a difference of 0.12%), Guatemalan (3.40, a difference of 0.12%), and Immigrants from Guyana (3.40, a difference of 0.16%).
| Demographics | Rating | Rank | Average Family Size |
| Native Hawaiians | 100.0 /100 | #26 | Exceptional 3.43 |
| Mexican American Indians | 100.0 /100 | #27 | Exceptional 3.43 |
| Immigrants | Latin America | 100.0 /100 | #28 | Exceptional 3.42 |
| Nepalese | 100.0 /100 | #29 | Exceptional 3.42 |
| Samoans | 100.0 /100 | #30 | Exceptional 3.42 |
| Central Americans | 100.0 /100 | #31 | Exceptional 3.41 |
| Immigrants | Guatemala | 100.0 /100 | #32 | Exceptional 3.41 |
| Hawaiians | 100.0 /100 | #33 | Exceptional 3.41 |
| Hispanics or Latinos | 100.0 /100 | #34 | Exceptional 3.41 |
| Guatemalans | 100.0 /100 | #35 | Exceptional 3.40 |
| Immigrants | Guyana | 100.0 /100 | #36 | Exceptional 3.40 |
| Guyanese | 100.0 /100 | #37 | Exceptional 3.40 |
| Immigrants | Belize | 100.0 /100 | #38 | Exceptional 3.39 |
| Immigrants | Haiti | 100.0 /100 | #39 | Exceptional 3.39 |
| Belizeans | 100.0 /100 | #40 | Exceptional 3.39 |
Demographics Similar to Immigrants from North Macedonia by Average Family Size
In terms of average family size, the demographic groups most similar to Immigrants from North Macedonia are Turkish (3.16, a difference of 0.010%), Potawatomi (3.16, a difference of 0.010%), Immigrants from Albania (3.16, a difference of 0.010%), Immigrants from Russia (3.16, a difference of 0.010%), and Albanian (3.17, a difference of 0.060%).
| Demographics | Rating | Rank | Average Family Size |
| Immigrants | Hungary | 1.7 /100 | #254 | Tragic 3.17 |
| Cape Verdeans | 1.6 /100 | #255 | Tragic 3.17 |
| Immigrants | Kazakhstan | 1.5 /100 | #256 | Tragic 3.17 |
| Albanians | 1.5 /100 | #257 | Tragic 3.17 |
| Turks | 1.3 /100 | #258 | Tragic 3.16 |
| Potawatomi | 1.3 /100 | #259 | Tragic 3.16 |
| Immigrants | Albania | 1.3 /100 | #260 | Tragic 3.16 |
| Immigrants | North Macedonia | 1.3 /100 | #261 | Tragic 3.16 |
| Immigrants | Russia | 1.3 /100 | #262 | Tragic 3.16 |
| Immigrants | Bulgaria | 1.0 /100 | #263 | Tragic 3.16 |
| Americans | 1.0 /100 | #264 | Tragic 3.16 |
| Immigrants | South Africa | 0.9 /100 | #265 | Tragic 3.16 |
| Immigrants | Greece | 0.9 /100 | #266 | Tragic 3.16 |
| Iroquois | 0.8 /100 | #267 | Tragic 3.16 |
| Maltese | 0.8 /100 | #268 | Tragic 3.16 |