Hawaiian vs Fijian Average Family Size
COMPARE
Hawaiian
Fijian
Average Family Size
Average Family Size Comparison
Hawaiians
Fijians
3.41
AVERAGE FAMILY SIZE
100.0/ 100
METRIC RATING
33rd/ 347
METRIC RANK
3.36
AVERAGE FAMILY SIZE
100.0/ 100
METRIC RATING
52nd/ 347
METRIC RANK
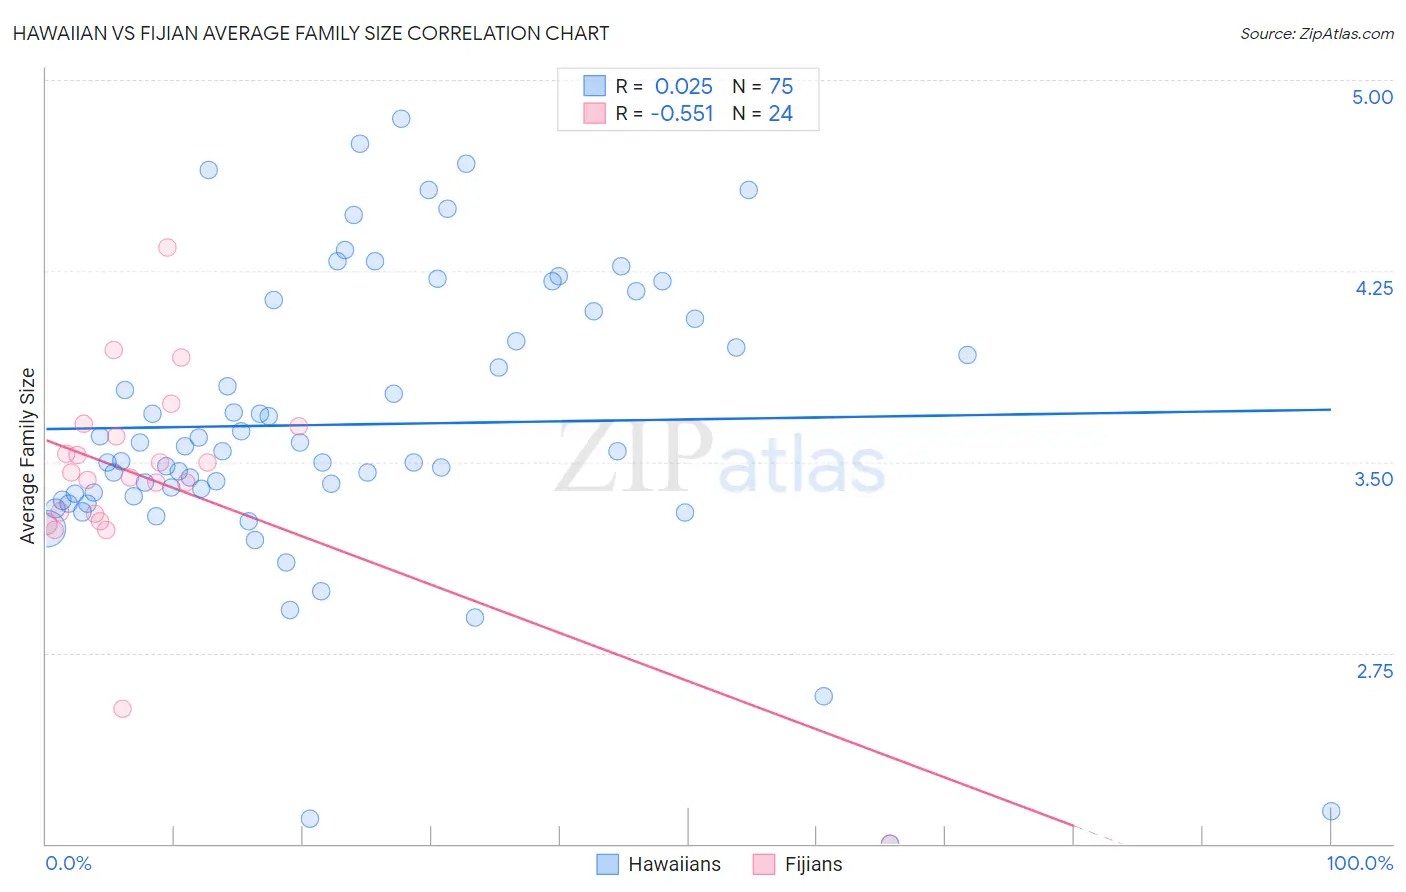
Hawaiian vs Fijian Average Family Size Correlation Chart
The statistical analysis conducted on geographies consisting of 327,392,742 people shows no correlation between the proportion of Hawaiians and average family size in the United States with a correlation coefficient (R) of 0.025 and weighted average of 3.41. Similarly, the statistical analysis conducted on geographies consisting of 55,947,966 people shows a substantial negative correlation between the proportion of Fijians and average family size in the United States with a correlation coefficient (R) of -0.551 and weighted average of 3.36, a difference of 1.5%.
Average Family Size Correlation Summary
| Measurement | Hawaiian | Fijian |
| Minimum | 2.00 | 2.00 |
| Maximum | 4.85 | 4.34 |
| Range | 2.85 | 2.34 |
| Mean | 3.65 | 3.42 |
| Median | 3.54 | 3.45 |
| Interquartile 25% (IQ1) | 3.37 | 3.28 |
| Interquartile 75% (IQ3) | 4.09 | 3.62 |
| Interquartile Range (IQR) | 0.72 | 0.34 |
| Standard Deviation (Sample) | 0.58 | 0.45 |
| Standard Deviation (Population) | 0.57 | 0.44 |
Demographics Similar to Hawaiians and Fijians by Average Family Size
In terms of average family size, the demographic groups most similar to Hawaiians are Immigrants from Guatemala (3.41, a difference of 0.030%), Hispanic or Latino (3.41, a difference of 0.050%), Guatemalan (3.40, a difference of 0.12%), Immigrants from Guyana (3.40, a difference of 0.16%), and Guyanese (3.40, a difference of 0.30%). Similarly, the demographic groups most similar to Fijians are Nicaraguan (3.36, a difference of 0.050%), Immigrants from Bangladesh (3.36, a difference of 0.13%), Bangladeshi (3.37, a difference of 0.26%), Immigrants from Nicaragua (3.37, a difference of 0.32%), and Vietnamese (3.37, a difference of 0.33%).
| Demographics | Rating | Rank | Average Family Size |
| Immigrants | Guatemala | 100.0 /100 | #32 | Exceptional 3.41 |
| Hawaiians | 100.0 /100 | #33 | Exceptional 3.41 |
| Hispanics or Latinos | 100.0 /100 | #34 | Exceptional 3.41 |
| Guatemalans | 100.0 /100 | #35 | Exceptional 3.40 |
| Immigrants | Guyana | 100.0 /100 | #36 | Exceptional 3.40 |
| Guyanese | 100.0 /100 | #37 | Exceptional 3.40 |
| Immigrants | Belize | 100.0 /100 | #38 | Exceptional 3.39 |
| Immigrants | Haiti | 100.0 /100 | #39 | Exceptional 3.39 |
| Belizeans | 100.0 /100 | #40 | Exceptional 3.39 |
| Marshallese | 100.0 /100 | #41 | Exceptional 3.38 |
| Immigrants | Vietnam | 100.0 /100 | #42 | Exceptional 3.38 |
| Immigrants | Philippines | 100.0 /100 | #43 | Exceptional 3.37 |
| Alaska Natives | 100.0 /100 | #44 | Exceptional 3.37 |
| Shoshone | 100.0 /100 | #45 | Exceptional 3.37 |
| Haitians | 100.0 /100 | #46 | Exceptional 3.37 |
| Vietnamese | 100.0 /100 | #47 | Exceptional 3.37 |
| Immigrants | Nicaragua | 100.0 /100 | #48 | Exceptional 3.37 |
| Bangladeshis | 100.0 /100 | #49 | Exceptional 3.37 |
| Immigrants | Bangladesh | 100.0 /100 | #50 | Exceptional 3.36 |
| Nicaraguans | 100.0 /100 | #51 | Exceptional 3.36 |
| Fijians | 100.0 /100 | #52 | Exceptional 3.36 |