Hawaiian vs Immigrants from Liberia Average Family Size
COMPARE
Hawaiian
Immigrants from Liberia
Average Family Size
Average Family Size Comparison
Hawaiians
Immigrants from Liberia
3.41
AVERAGE FAMILY SIZE
100.0/ 100
METRIC RATING
33rd/ 347
METRIC RANK
3.27
AVERAGE FAMILY SIZE
95.0/ 100
METRIC RATING
115th/ 347
METRIC RANK
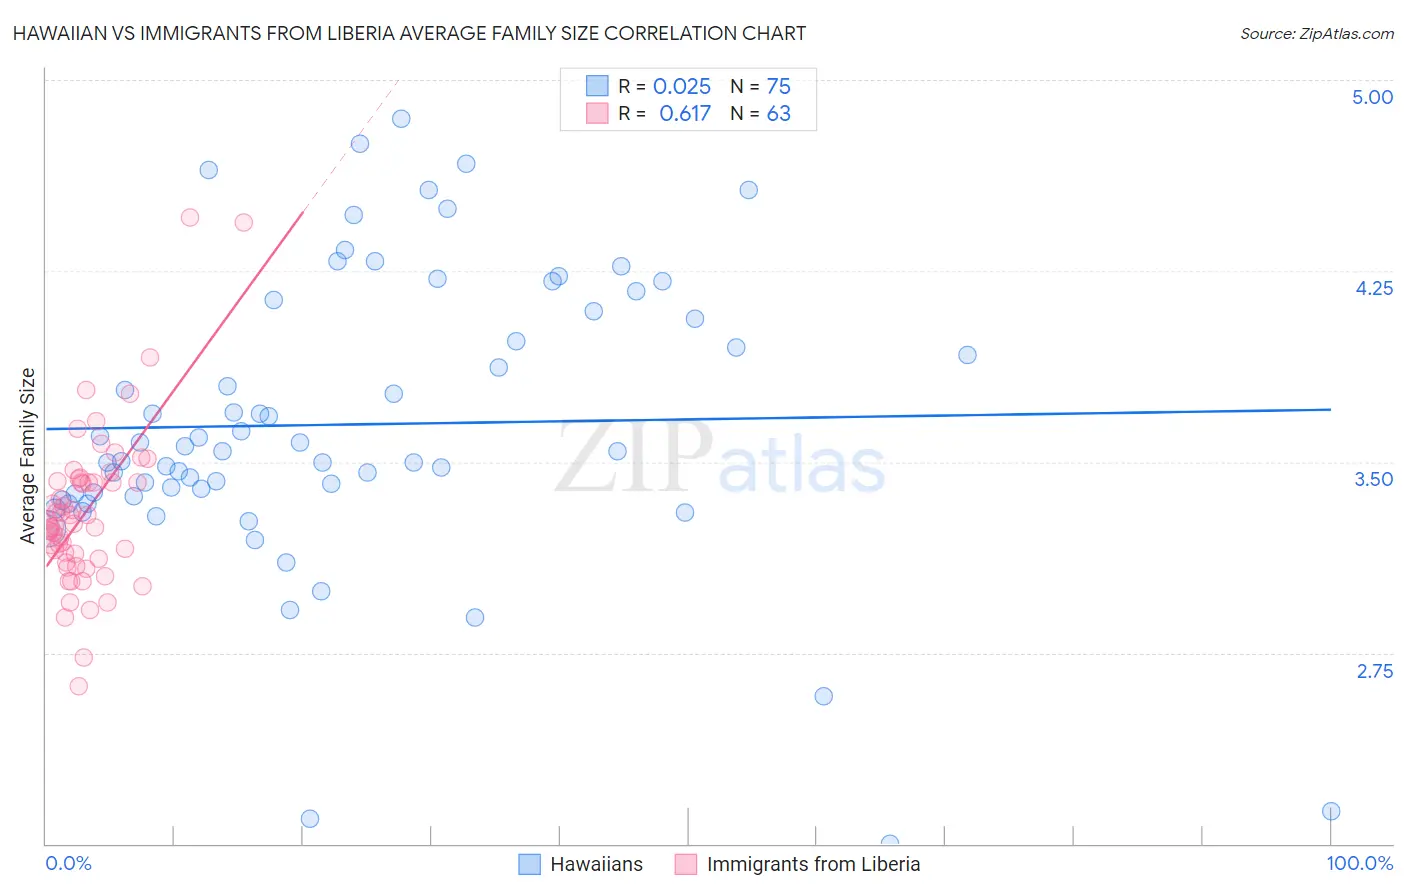
Hawaiian vs Immigrants from Liberia Average Family Size Correlation Chart
The statistical analysis conducted on geographies consisting of 327,392,742 people shows no correlation between the proportion of Hawaiians and average family size in the United States with a correlation coefficient (R) of 0.025 and weighted average of 3.41. Similarly, the statistical analysis conducted on geographies consisting of 135,241,796 people shows a significant positive correlation between the proportion of Immigrants from Liberia and average family size in the United States with a correlation coefficient (R) of 0.617 and weighted average of 3.27, a difference of 4.2%.
Average Family Size Correlation Summary
| Measurement | Hawaiian | Immigrants from Liberia |
| Minimum | 2.00 | 2.62 |
| Maximum | 4.85 | 4.46 |
| Range | 2.85 | 1.84 |
| Mean | 3.65 | 3.31 |
| Median | 3.54 | 3.26 |
| Interquartile 25% (IQ1) | 3.37 | 3.12 |
| Interquartile 75% (IQ3) | 4.09 | 3.42 |
| Interquartile Range (IQR) | 0.72 | 0.30 |
| Standard Deviation (Sample) | 0.58 | 0.32 |
| Standard Deviation (Population) | 0.57 | 0.31 |
Similar Demographics by Average Family Size
Demographics Similar to Hawaiians by Average Family Size
In terms of average family size, the demographic groups most similar to Hawaiians are Immigrants from Guatemala (3.41, a difference of 0.030%), Hispanic or Latino (3.41, a difference of 0.050%), Central American (3.41, a difference of 0.12%), Guatemalan (3.40, a difference of 0.12%), and Immigrants from Guyana (3.40, a difference of 0.16%).
| Demographics | Rating | Rank | Average Family Size |
| Native Hawaiians | 100.0 /100 | #26 | Exceptional 3.43 |
| Mexican American Indians | 100.0 /100 | #27 | Exceptional 3.43 |
| Immigrants | Latin America | 100.0 /100 | #28 | Exceptional 3.42 |
| Nepalese | 100.0 /100 | #29 | Exceptional 3.42 |
| Samoans | 100.0 /100 | #30 | Exceptional 3.42 |
| Central Americans | 100.0 /100 | #31 | Exceptional 3.41 |
| Immigrants | Guatemala | 100.0 /100 | #32 | Exceptional 3.41 |
| Hawaiians | 100.0 /100 | #33 | Exceptional 3.41 |
| Hispanics or Latinos | 100.0 /100 | #34 | Exceptional 3.41 |
| Guatemalans | 100.0 /100 | #35 | Exceptional 3.40 |
| Immigrants | Guyana | 100.0 /100 | #36 | Exceptional 3.40 |
| Guyanese | 100.0 /100 | #37 | Exceptional 3.40 |
| Immigrants | Belize | 100.0 /100 | #38 | Exceptional 3.39 |
| Immigrants | Haiti | 100.0 /100 | #39 | Exceptional 3.39 |
| Belizeans | 100.0 /100 | #40 | Exceptional 3.39 |
Demographics Similar to Immigrants from Liberia by Average Family Size
In terms of average family size, the demographic groups most similar to Immigrants from Liberia are Immigrants from South America (3.27, a difference of 0.0%), South American (3.27, a difference of 0.010%), Kiowa (3.27, a difference of 0.020%), Immigrants from Panama (3.27, a difference of 0.060%), and Black/African American (3.27, a difference of 0.070%).
| Demographics | Rating | Rank | Average Family Size |
| Asians | 97.0 /100 | #108 | Exceptional 3.28 |
| Puerto Ricans | 96.7 /100 | #109 | Exceptional 3.28 |
| Bahamians | 96.6 /100 | #110 | Exceptional 3.28 |
| Indonesians | 96.2 /100 | #111 | Exceptional 3.28 |
| Blacks/African Americans | 95.7 /100 | #112 | Exceptional 3.27 |
| Immigrants | Panama | 95.6 /100 | #113 | Exceptional 3.27 |
| South Americans | 95.1 /100 | #114 | Exceptional 3.27 |
| Immigrants | Liberia | 95.0 /100 | #115 | Exceptional 3.27 |
| Immigrants | South America | 95.0 /100 | #116 | Exceptional 3.27 |
| Kiowa | 94.8 /100 | #117 | Exceptional 3.27 |
| Immigrants | Asia | 94.0 /100 | #118 | Exceptional 3.27 |
| Immigrants | Indonesia | 93.7 /100 | #119 | Exceptional 3.27 |
| Immigrants | Bahamas | 93.6 /100 | #120 | Exceptional 3.27 |
| Immigrants | Thailand | 93.3 /100 | #121 | Exceptional 3.27 |
| Immigrants | Colombia | 92.8 /100 | #122 | Exceptional 3.27 |