Immigrants from Costa Rica vs Immigrants from North Macedonia Average Family Size
COMPARE
Immigrants from Costa Rica
Immigrants from North Macedonia
Average Family Size
Average Family Size Comparison
Immigrants from Costa Rica
Immigrants from North Macedonia
3.26
AVERAGE FAMILY SIZE
90.7/ 100
METRIC RATING
126th/ 347
METRIC RANK
3.16
AVERAGE FAMILY SIZE
1.3/ 100
METRIC RATING
261st/ 347
METRIC RANK
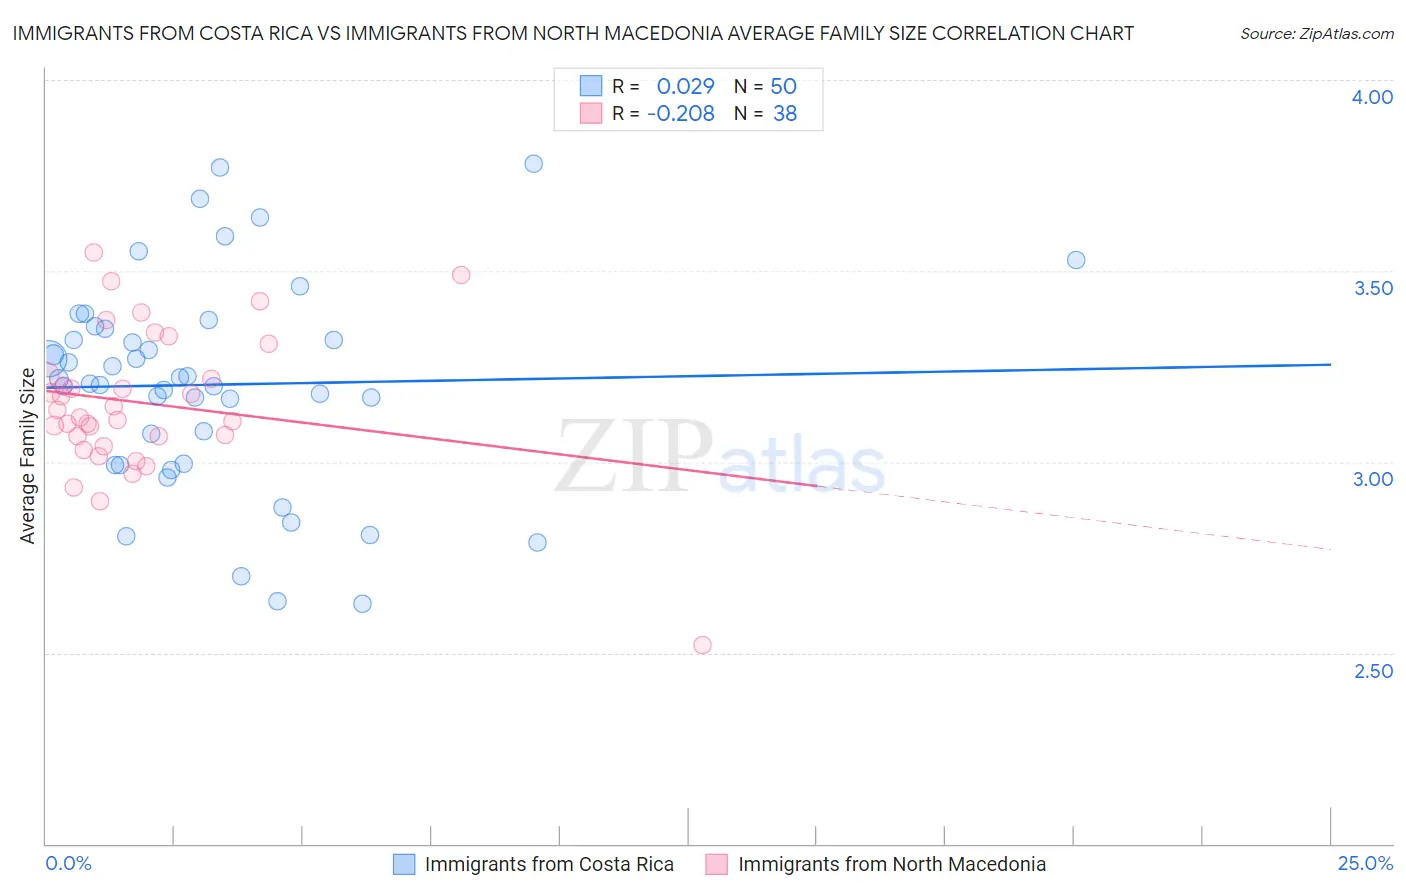
Immigrants from Costa Rica vs Immigrants from North Macedonia Average Family Size Correlation Chart
The statistical analysis conducted on geographies consisting of 204,251,224 people shows no correlation between the proportion of Immigrants from Costa Rica and average family size in the United States with a correlation coefficient (R) of 0.029 and weighted average of 3.26. Similarly, the statistical analysis conducted on geographies consisting of 74,306,697 people shows a weak negative correlation between the proportion of Immigrants from North Macedonia and average family size in the United States with a correlation coefficient (R) of -0.208 and weighted average of 3.16, a difference of 3.1%.
Average Family Size Correlation Summary
| Measurement | Immigrants from Costa Rica | Immigrants from North Macedonia |
| Minimum | 2.63 | 2.52 |
| Maximum | 3.78 | 3.55 |
| Range | 1.15 | 1.03 |
| Mean | 3.20 | 3.15 |
| Median | 3.21 | 3.13 |
| Interquartile 25% (IQ1) | 2.99 | 3.07 |
| Interquartile 75% (IQ3) | 3.35 | 3.23 |
| Interquartile Range (IQR) | 0.36 | 0.16 |
| Standard Deviation (Sample) | 0.27 | 0.19 |
| Standard Deviation (Population) | 0.27 | 0.19 |
Similar Demographics by Average Family Size
Demographics Similar to Immigrants from Costa Rica by Average Family Size
In terms of average family size, the demographic groups most similar to Immigrants from Costa Rica are Immigrants from Syria (3.26, a difference of 0.010%), Immigrants from Cuba (3.26, a difference of 0.030%), Colombian (3.26, a difference of 0.040%), South American Indian (3.26, a difference of 0.050%), and Alaskan Athabascan (3.27, a difference of 0.10%).
| Demographics | Rating | Rank | Average Family Size |
| Immigrants | Indonesia | 93.7 /100 | #119 | Exceptional 3.27 |
| Immigrants | Bahamas | 93.6 /100 | #120 | Exceptional 3.27 |
| Immigrants | Thailand | 93.3 /100 | #121 | Exceptional 3.27 |
| Immigrants | Colombia | 92.8 /100 | #122 | Exceptional 3.27 |
| Alaskan Athabascans | 92.4 /100 | #123 | Exceptional 3.27 |
| South American Indians | 91.6 /100 | #124 | Exceptional 3.26 |
| Immigrants | Cuba | 91.3 /100 | #125 | Exceptional 3.26 |
| Immigrants | Costa Rica | 90.7 /100 | #126 | Exceptional 3.26 |
| Immigrants | Syria | 90.6 /100 | #127 | Exceptional 3.26 |
| Colombians | 89.9 /100 | #128 | Excellent 3.26 |
| Immigrants | Hong Kong | 88.6 /100 | #129 | Excellent 3.26 |
| Laotians | 88.5 /100 | #130 | Excellent 3.26 |
| Immigrants | Western Asia | 87.7 /100 | #131 | Excellent 3.26 |
| Costa Ricans | 86.8 /100 | #132 | Excellent 3.26 |
| Immigrants | Venezuela | 86.3 /100 | #133 | Excellent 3.26 |
Demographics Similar to Immigrants from North Macedonia by Average Family Size
In terms of average family size, the demographic groups most similar to Immigrants from North Macedonia are Turkish (3.16, a difference of 0.010%), Potawatomi (3.16, a difference of 0.010%), Immigrants from Albania (3.16, a difference of 0.010%), Immigrants from Russia (3.16, a difference of 0.010%), and Albanian (3.17, a difference of 0.060%).
| Demographics | Rating | Rank | Average Family Size |
| Immigrants | Hungary | 1.7 /100 | #254 | Tragic 3.17 |
| Cape Verdeans | 1.6 /100 | #255 | Tragic 3.17 |
| Immigrants | Kazakhstan | 1.5 /100 | #256 | Tragic 3.17 |
| Albanians | 1.5 /100 | #257 | Tragic 3.17 |
| Turks | 1.3 /100 | #258 | Tragic 3.16 |
| Potawatomi | 1.3 /100 | #259 | Tragic 3.16 |
| Immigrants | Albania | 1.3 /100 | #260 | Tragic 3.16 |
| Immigrants | North Macedonia | 1.3 /100 | #261 | Tragic 3.16 |
| Immigrants | Russia | 1.3 /100 | #262 | Tragic 3.16 |
| Immigrants | Bulgaria | 1.0 /100 | #263 | Tragic 3.16 |
| Americans | 1.0 /100 | #264 | Tragic 3.16 |
| Immigrants | South Africa | 0.9 /100 | #265 | Tragic 3.16 |
| Immigrants | Greece | 0.9 /100 | #266 | Tragic 3.16 |
| Iroquois | 0.8 /100 | #267 | Tragic 3.16 |
| Maltese | 0.8 /100 | #268 | Tragic 3.16 |