Aleut vs Immigrants from North Macedonia Average Family Size
COMPARE
Aleut
Immigrants from North Macedonia
Average Family Size
Average Family Size Comparison
Aleuts
Immigrants from North Macedonia
3.23
AVERAGE FAMILY SIZE
54.1/ 100
METRIC RATING
169th/ 347
METRIC RANK
3.16
AVERAGE FAMILY SIZE
1.3/ 100
METRIC RATING
261st/ 347
METRIC RANK
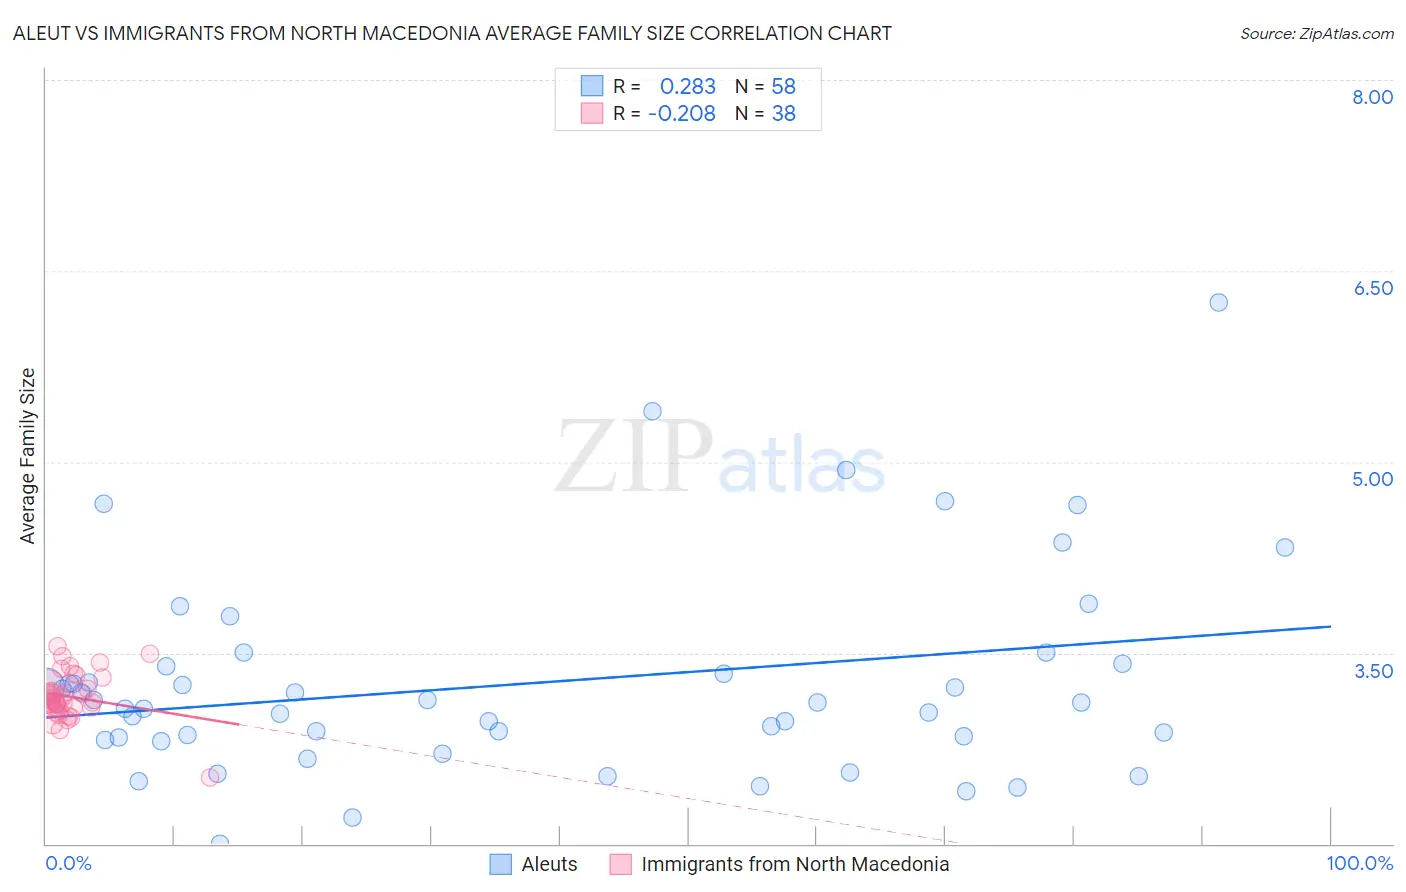
Aleut vs Immigrants from North Macedonia Average Family Size Correlation Chart
The statistical analysis conducted on geographies consisting of 61,774,042 people shows a weak positive correlation between the proportion of Aleuts and average family size in the United States with a correlation coefficient (R) of 0.283 and weighted average of 3.23. Similarly, the statistical analysis conducted on geographies consisting of 74,306,697 people shows a weak negative correlation between the proportion of Immigrants from North Macedonia and average family size in the United States with a correlation coefficient (R) of -0.208 and weighted average of 3.16, a difference of 2.1%.
Average Family Size Correlation Summary
| Measurement | Aleut | Immigrants from North Macedonia |
| Minimum | 2.00 | 2.52 |
| Maximum | 6.25 | 3.55 |
| Range | 4.25 | 1.03 |
| Mean | 3.26 | 3.15 |
| Median | 3.11 | 3.13 |
| Interquartile 25% (IQ1) | 2.84 | 3.07 |
| Interquartile 75% (IQ3) | 3.39 | 3.23 |
| Interquartile Range (IQR) | 0.55 | 0.16 |
| Standard Deviation (Sample) | 0.80 | 0.19 |
| Standard Deviation (Population) | 0.79 | 0.19 |
Similar Demographics by Average Family Size
Demographics Similar to Aleuts by Average Family Size
In terms of average family size, the demographic groups most similar to Aleuts are Taiwanese (3.23, a difference of 0.0%), Arab (3.23, a difference of 0.010%), Chilean (3.23, a difference of 0.020%), Immigrants from Congo (3.23, a difference of 0.030%), and Immigrants from Uruguay (3.23, a difference of 0.040%).
| Demographics | Rating | Rank | Average Family Size |
| Immigrants | Uganda | 60.1 /100 | #162 | Good 3.23 |
| Uruguayans | 58.8 /100 | #163 | Average 3.23 |
| Egyptians | 58.6 /100 | #164 | Average 3.23 |
| Ugandans | 58.4 /100 | #165 | Average 3.23 |
| Immigrants | Senegal | 57.5 /100 | #166 | Average 3.23 |
| Dutch West Indians | 56.9 /100 | #167 | Average 3.23 |
| Taiwanese | 54.2 /100 | #168 | Average 3.23 |
| Aleuts | 54.1 /100 | #169 | Average 3.23 |
| Arabs | 53.8 /100 | #170 | Average 3.23 |
| Chileans | 53.2 /100 | #171 | Average 3.23 |
| Immigrants | Congo | 52.7 /100 | #172 | Average 3.23 |
| Immigrants | Uruguay | 52.0 /100 | #173 | Average 3.23 |
| Immigrants | South Central Asia | 50.0 /100 | #174 | Average 3.23 |
| Immigrants | China | 49.9 /100 | #175 | Average 3.23 |
| Israelis | 48.7 /100 | #176 | Average 3.23 |
Demographics Similar to Immigrants from North Macedonia by Average Family Size
In terms of average family size, the demographic groups most similar to Immigrants from North Macedonia are Turkish (3.16, a difference of 0.010%), Potawatomi (3.16, a difference of 0.010%), Immigrants from Albania (3.16, a difference of 0.010%), Immigrants from Russia (3.16, a difference of 0.010%), and Albanian (3.17, a difference of 0.060%).
| Demographics | Rating | Rank | Average Family Size |
| Immigrants | Hungary | 1.7 /100 | #254 | Tragic 3.17 |
| Cape Verdeans | 1.6 /100 | #255 | Tragic 3.17 |
| Immigrants | Kazakhstan | 1.5 /100 | #256 | Tragic 3.17 |
| Albanians | 1.5 /100 | #257 | Tragic 3.17 |
| Turks | 1.3 /100 | #258 | Tragic 3.16 |
| Potawatomi | 1.3 /100 | #259 | Tragic 3.16 |
| Immigrants | Albania | 1.3 /100 | #260 | Tragic 3.16 |
| Immigrants | North Macedonia | 1.3 /100 | #261 | Tragic 3.16 |
| Immigrants | Russia | 1.3 /100 | #262 | Tragic 3.16 |
| Immigrants | Bulgaria | 1.0 /100 | #263 | Tragic 3.16 |
| Americans | 1.0 /100 | #264 | Tragic 3.16 |
| Immigrants | South Africa | 0.9 /100 | #265 | Tragic 3.16 |
| Immigrants | Greece | 0.9 /100 | #266 | Tragic 3.16 |
| Iroquois | 0.8 /100 | #267 | Tragic 3.16 |
| Maltese | 0.8 /100 | #268 | Tragic 3.16 |