Haitian vs Mexican Master's Degree
COMPARE
Haitian
Mexican
Master's Degree
Master's Degree Comparison
Haitians
Mexicans
12.1%
MASTER'S DEGREE
0.3/ 100
METRIC RATING
271st/ 347
METRIC RANK
9.7%
MASTER'S DEGREE
0.0/ 100
METRIC RATING
337th/ 347
METRIC RANK
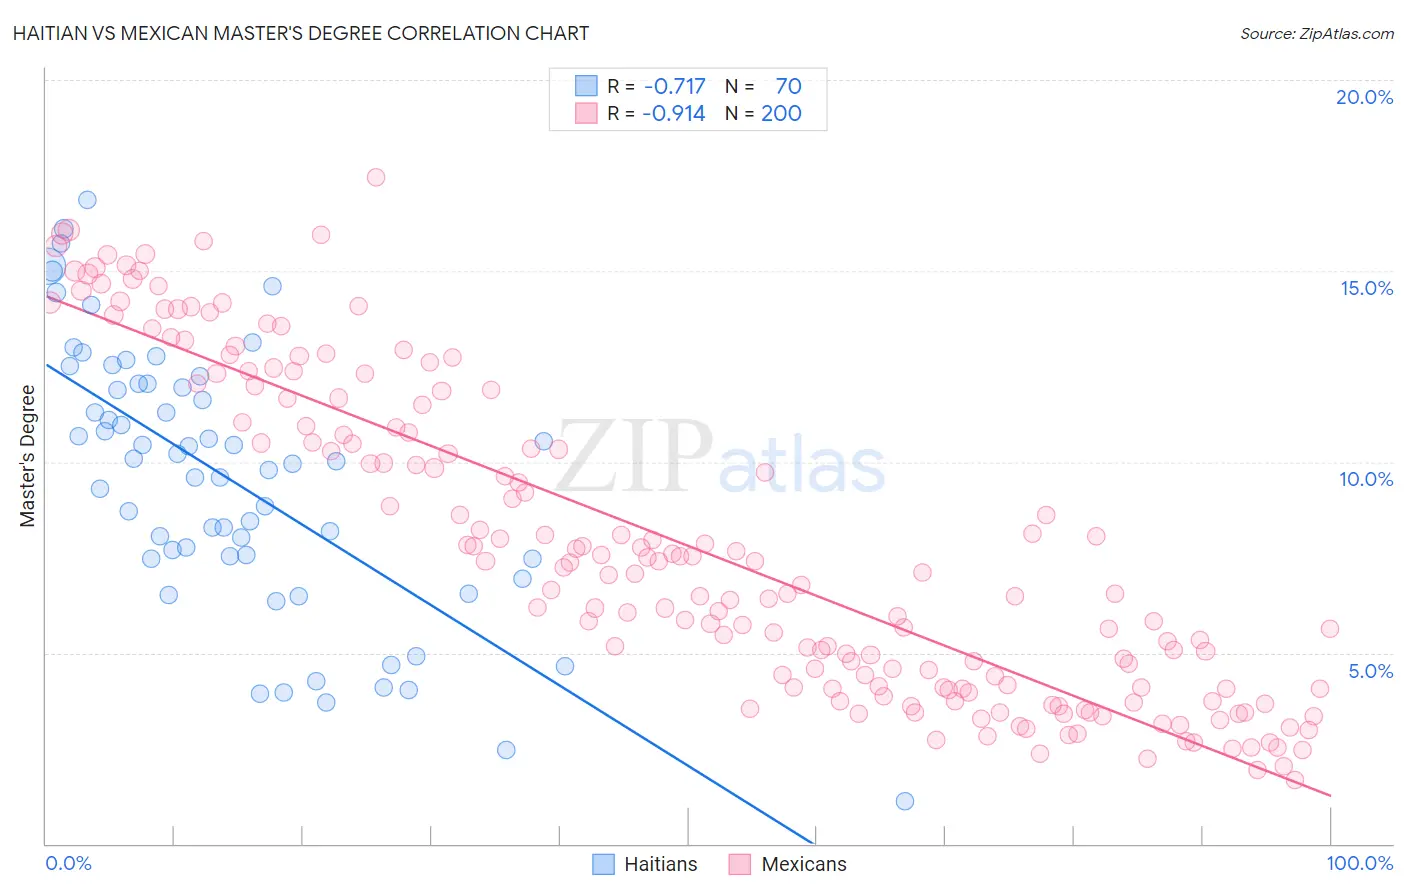
Haitian vs Mexican Master's Degree Correlation Chart
The statistical analysis conducted on geographies consisting of 287,849,817 people shows a strong negative correlation between the proportion of Haitians and percentage of population with at least master's degree education in the United States with a correlation coefficient (R) of -0.717 and weighted average of 12.1%. Similarly, the statistical analysis conducted on geographies consisting of 564,212,765 people shows a near-perfect negative correlation between the proportion of Mexicans and percentage of population with at least master's degree education in the United States with a correlation coefficient (R) of -0.914 and weighted average of 9.7%, a difference of 24.6%.
Master's Degree Correlation Summary
| Measurement | Haitian | Mexican |
| Minimum | 1.1% | 1.7% |
| Maximum | 16.9% | 17.4% |
| Range | 15.8% | 15.8% |
| Mean | 9.5% | 7.8% |
| Median | 10.0% | 7.1% |
| Interquartile 25% (IQ1) | 7.5% | 4.1% |
| Interquartile 75% (IQ3) | 12.0% | 11.3% |
| Interquartile Range (IQR) | 4.6% | 7.2% |
| Standard Deviation (Sample) | 3.5% | 4.1% |
| Standard Deviation (Population) | 3.5% | 4.1% |
Similar Demographics by Master's Degree
Demographics Similar to Haitians by Master's Degree
In terms of master's degree, the demographic groups most similar to Haitians are Comanche (12.1%, a difference of 0.060%), Blackfeet (12.1%, a difference of 0.15%), Cape Verdean (12.1%, a difference of 0.24%), Cuban (12.1%, a difference of 0.25%), and Black/African American (12.1%, a difference of 0.31%).
| Demographics | Rating | Rank | Master's Degree |
| Belizeans | 0.5 /100 | #264 | Tragic 12.4% |
| Immigrants | Fiji | 0.5 /100 | #265 | Tragic 12.4% |
| Bahamians | 0.5 /100 | #266 | Tragic 12.4% |
| Americans | 0.4 /100 | #267 | Tragic 12.3% |
| Native Hawaiians | 0.4 /100 | #268 | Tragic 12.3% |
| Central Americans | 0.3 /100 | #269 | Tragic 12.2% |
| Salvadorans | 0.3 /100 | #270 | Tragic 12.2% |
| Haitians | 0.3 /100 | #271 | Tragic 12.1% |
| Comanche | 0.3 /100 | #272 | Tragic 12.1% |
| Blackfeet | 0.3 /100 | #273 | Tragic 12.1% |
| Cape Verdeans | 0.3 /100 | #274 | Tragic 12.1% |
| Cubans | 0.3 /100 | #275 | Tragic 12.1% |
| Blacks/African Americans | 0.3 /100 | #276 | Tragic 12.1% |
| Immigrants | Caribbean | 0.3 /100 | #277 | Tragic 12.1% |
| Potawatomi | 0.3 /100 | #278 | Tragic 12.1% |
Demographics Similar to Mexicans by Master's Degree
In terms of master's degree, the demographic groups most similar to Mexicans are Tohono O'odham (9.7%, a difference of 0.080%), Spanish American Indian (9.6%, a difference of 1.4%), Native/Alaskan (9.9%, a difference of 2.2%), Yakama (9.5%, a difference of 2.6%), and Immigrants from Central America (10.0%, a difference of 2.8%).
| Demographics | Rating | Rank | Master's Degree |
| Fijians | 0.0 /100 | #330 | Tragic 10.3% |
| Pueblo | 0.0 /100 | #331 | Tragic 10.3% |
| Immigrants | Azores | 0.0 /100 | #332 | Tragic 10.2% |
| Menominee | 0.0 /100 | #333 | Tragic 10.2% |
| Arapaho | 0.0 /100 | #334 | Tragic 10.0% |
| Immigrants | Central America | 0.0 /100 | #335 | Tragic 10.0% |
| Natives/Alaskans | 0.0 /100 | #336 | Tragic 9.9% |
| Mexicans | 0.0 /100 | #337 | Tragic 9.7% |
| Tohono O'odham | 0.0 /100 | #338 | Tragic 9.7% |
| Spanish American Indians | 0.0 /100 | #339 | Tragic 9.6% |
| Yakama | 0.0 /100 | #340 | Tragic 9.5% |
| Navajo | 0.0 /100 | #341 | Tragic 9.4% |
| Immigrants | Mexico | 0.0 /100 | #342 | Tragic 9.3% |
| Lumbee | 0.0 /100 | #343 | Tragic 9.3% |
| Pima | 0.0 /100 | #344 | Tragic 9.2% |