Honduran vs Asian Average Family Size
COMPARE
Honduran
Asian
Average Family Size
Average Family Size Comparison
Hondurans
Asians
3.35
AVERAGE FAMILY SIZE
100.0/ 100
METRIC RATING
58th/ 347
METRIC RANK
3.28
AVERAGE FAMILY SIZE
97.0/ 100
METRIC RATING
108th/ 347
METRIC RANK
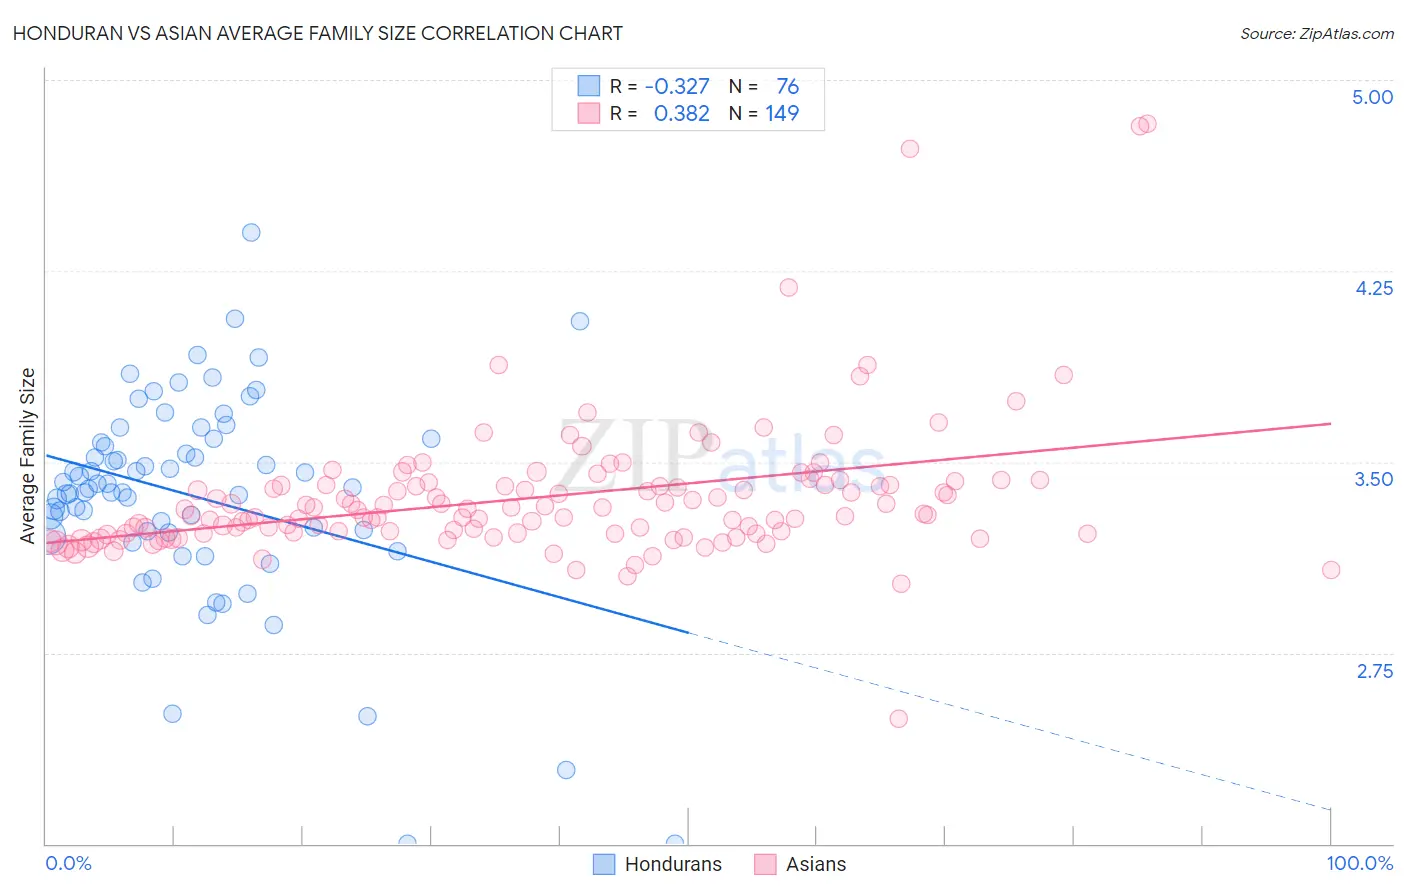
Honduran vs Asian Average Family Size Correlation Chart
The statistical analysis conducted on geographies consisting of 357,606,551 people shows a mild negative correlation between the proportion of Hondurans and average family size in the United States with a correlation coefficient (R) of -0.327 and weighted average of 3.35. Similarly, the statistical analysis conducted on geographies consisting of 550,276,213 people shows a mild positive correlation between the proportion of Asians and average family size in the United States with a correlation coefficient (R) of 0.382 and weighted average of 3.28, a difference of 2.2%.
Average Family Size Correlation Summary
| Measurement | Honduran | Asian |
| Minimum | 2.00 | 2.49 |
| Maximum | 4.40 | 4.83 |
| Range | 2.40 | 2.34 |
| Mean | 3.37 | 3.36 |
| Median | 3.40 | 3.29 |
| Interquartile 25% (IQ1) | 3.23 | 3.22 |
| Interquartile 75% (IQ3) | 3.58 | 3.41 |
| Interquartile Range (IQR) | 0.36 | 0.19 |
| Standard Deviation (Sample) | 0.41 | 0.28 |
| Standard Deviation (Population) | 0.41 | 0.28 |
Similar Demographics by Average Family Size
Demographics Similar to Hondurans by Average Family Size
In terms of average family size, the demographic groups most similar to Hondurans are Sri Lankan (3.35, a difference of 0.010%), Immigrants from Dominican Republic (3.35, a difference of 0.060%), Japanese (3.35, a difference of 0.090%), Immigrants from Armenia (3.35, a difference of 0.11%), and Immigrants from Honduras (3.36, a difference of 0.13%).
| Demographics | Rating | Rank | Average Family Size |
| Nicaraguans | 100.0 /100 | #51 | Exceptional 3.36 |
| Fijians | 100.0 /100 | #52 | Exceptional 3.36 |
| Koreans | 100.0 /100 | #53 | Exceptional 3.36 |
| Immigrants | South Eastern Asia | 100.0 /100 | #54 | Exceptional 3.36 |
| Immigrants | Honduras | 100.0 /100 | #55 | Exceptional 3.36 |
| Immigrants | Dominican Republic | 100.0 /100 | #56 | Exceptional 3.35 |
| Sri Lankans | 100.0 /100 | #57 | Exceptional 3.35 |
| Hondurans | 100.0 /100 | #58 | Exceptional 3.35 |
| Japanese | 100.0 /100 | #59 | Exceptional 3.35 |
| Immigrants | Armenia | 100.0 /100 | #60 | Exceptional 3.35 |
| Central American Indians | 100.0 /100 | #61 | Exceptional 3.35 |
| Immigrants | Grenada | 100.0 /100 | #62 | Exceptional 3.34 |
| Chinese | 100.0 /100 | #63 | Exceptional 3.34 |
| Dominicans | 99.9 /100 | #64 | Exceptional 3.34 |
| Immigrants | Laos | 99.9 /100 | #65 | Exceptional 3.34 |
Demographics Similar to Asians by Average Family Size
In terms of average family size, the demographic groups most similar to Asians are Puerto Rican (3.28, a difference of 0.050%), Bahamian (3.28, a difference of 0.060%), Indonesian (3.28, a difference of 0.11%), Ghanaian (3.29, a difference of 0.17%), and Black/African American (3.27, a difference of 0.17%).
| Demographics | Rating | Rank | Average Family Size |
| Immigrants | Burma/Myanmar | 98.6 /100 | #101 | Exceptional 3.29 |
| West Indians | 98.5 /100 | #102 | Exceptional 3.29 |
| Immigrants | Western Africa | 98.4 /100 | #103 | Exceptional 3.29 |
| Bolivians | 98.3 /100 | #104 | Exceptional 3.29 |
| Immigrants | Ghana | 98.1 /100 | #105 | Exceptional 3.29 |
| Paiute | 98.0 /100 | #106 | Exceptional 3.29 |
| Ghanaians | 98.0 /100 | #107 | Exceptional 3.29 |
| Asians | 97.0 /100 | #108 | Exceptional 3.28 |
| Puerto Ricans | 96.7 /100 | #109 | Exceptional 3.28 |
| Bahamians | 96.6 /100 | #110 | Exceptional 3.28 |
| Indonesians | 96.2 /100 | #111 | Exceptional 3.28 |
| Blacks/African Americans | 95.7 /100 | #112 | Exceptional 3.27 |
| Immigrants | Panama | 95.6 /100 | #113 | Exceptional 3.27 |
| South Americans | 95.1 /100 | #114 | Exceptional 3.27 |
| Immigrants | Liberia | 95.0 /100 | #115 | Exceptional 3.27 |