Immigrants from Zaire vs Jordanian Single Father Households
COMPARE
Immigrants from Zaire
Jordanian
Single Father Households
Single Father Households Comparison
Immigrants from Zaire
Jordanians
2.4%
SINGLE FATHER HOUSEHOLDS
8.6/ 100
METRIC RATING
229th/ 347
METRIC RANK
2.2%
SINGLE FATHER HOUSEHOLDS
96.9/ 100
METRIC RATING
127th/ 347
METRIC RANK
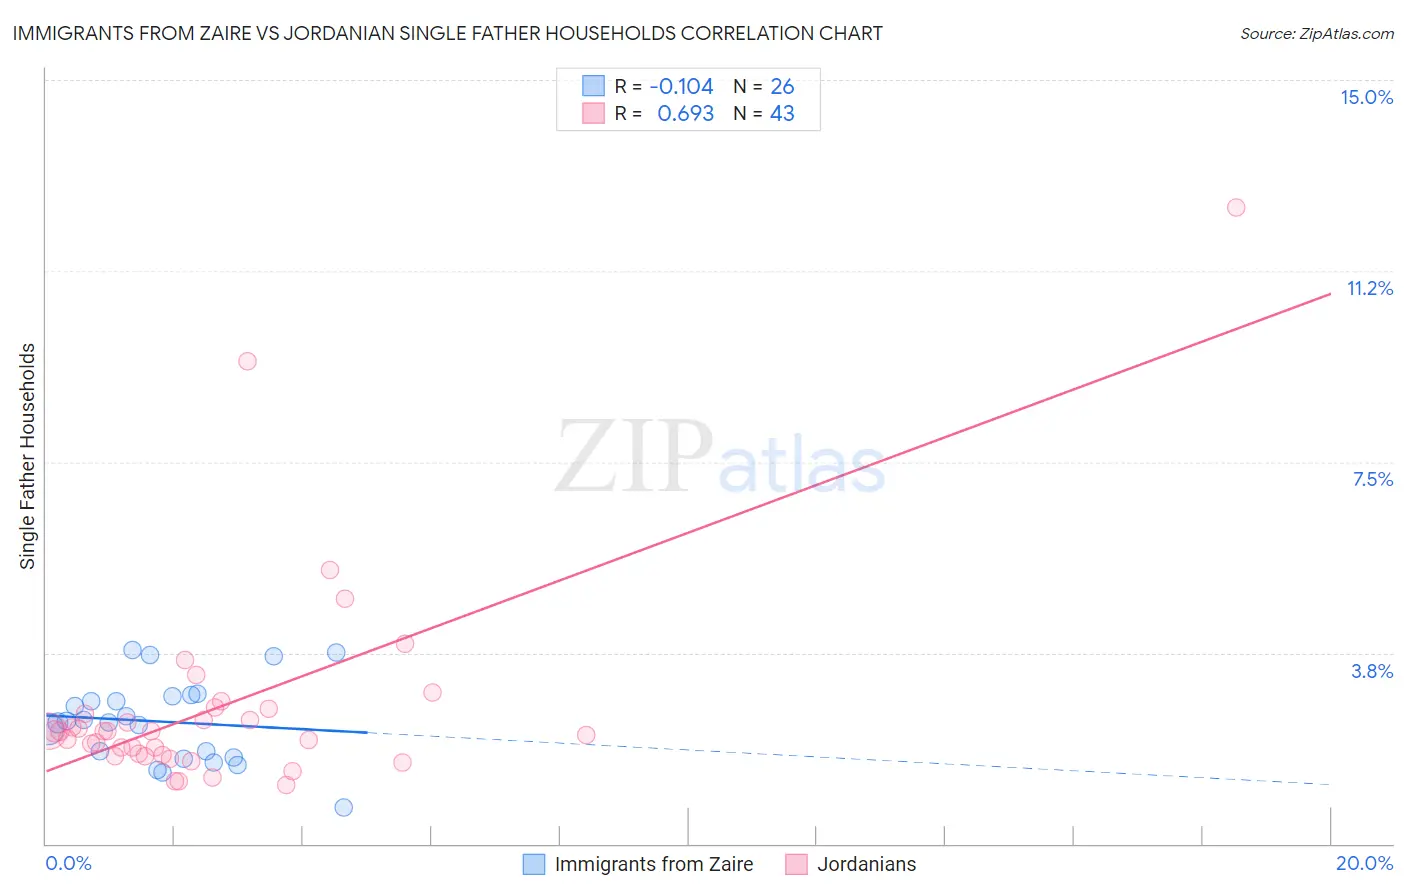
Immigrants from Zaire vs Jordanian Single Father Households Correlation Chart
The statistical analysis conducted on geographies consisting of 107,136,066 people shows a poor negative correlation between the proportion of Immigrants from Zaire and percentage of single father households in the United States with a correlation coefficient (R) of -0.104 and weighted average of 2.4%. Similarly, the statistical analysis conducted on geographies consisting of 165,930,664 people shows a significant positive correlation between the proportion of Jordanians and percentage of single father households in the United States with a correlation coefficient (R) of 0.693 and weighted average of 2.2%, a difference of 11.4%.
Single Father Households Correlation Summary
| Measurement | Immigrants from Zaire | Jordanian |
| Minimum | 0.70% | 1.1% |
| Maximum | 3.8% | 12.5% |
| Range | 3.1% | 11.4% |
| Mean | 2.4% | 2.7% |
| Median | 2.4% | 2.2% |
| Interquartile 25% (IQ1) | 1.7% | 1.7% |
| Interquartile 75% (IQ3) | 2.9% | 2.6% |
| Interquartile Range (IQR) | 1.2% | 0.89% |
| Standard Deviation (Sample) | 0.81% | 2.1% |
| Standard Deviation (Population) | 0.79% | 2.0% |
Similar Demographics by Single Father Households
Demographics Similar to Immigrants from Zaire by Single Father Households
In terms of single father households, the demographic groups most similar to Immigrants from Zaire are Subsaharan African (2.4%, a difference of 0.090%), Immigrants from Ghana (2.4%, a difference of 0.11%), American (2.4%, a difference of 0.15%), Black/African American (2.4%, a difference of 0.21%), and Marshallese (2.4%, a difference of 0.23%).
| Demographics | Rating | Rank | Single Father Households |
| Immigrants | Eastern Africa | 11.9 /100 | #222 | Poor 2.4% |
| Immigrants | Uruguay | 11.0 /100 | #223 | Poor 2.4% |
| Immigrants | Bahamas | 10.6 /100 | #224 | Poor 2.4% |
| Marshallese | 9.7 /100 | #225 | Tragic 2.4% |
| Blacks/African Americans | 9.7 /100 | #226 | Tragic 2.4% |
| Americans | 9.3 /100 | #227 | Tragic 2.4% |
| Immigrants | Ghana | 9.1 /100 | #228 | Tragic 2.4% |
| Immigrants | Zaire | 8.6 /100 | #229 | Tragic 2.4% |
| Sub-Saharan Africans | 8.3 /100 | #230 | Tragic 2.4% |
| Immigrants | Nonimmigrants | 7.6 /100 | #231 | Tragic 2.4% |
| Pennsylvania Germans | 7.3 /100 | #232 | Tragic 2.4% |
| Immigrants | Western Africa | 7.0 /100 | #233 | Tragic 2.4% |
| Africans | 6.3 /100 | #234 | Tragic 2.5% |
| Immigrants | Immigrants | 6.3 /100 | #235 | Tragic 2.5% |
| Cajuns | 6.1 /100 | #236 | Tragic 2.5% |
Demographics Similar to Jordanians by Single Father Households
In terms of single father households, the demographic groups most similar to Jordanians are Moroccan (2.2%, a difference of 0.0%), Immigrants from England (2.2%, a difference of 0.040%), Serbian (2.2%, a difference of 0.050%), Immigrants from Chile (2.2%, a difference of 0.17%), and Immigrants from Jordan (2.2%, a difference of 0.23%).
| Demographics | Rating | Rank | Single Father Households |
| Australians | 97.7 /100 | #120 | Exceptional 2.2% |
| Immigrants | Brazil | 97.7 /100 | #121 | Exceptional 2.2% |
| Immigrants | Iraq | 97.6 /100 | #122 | Exceptional 2.2% |
| Immigrants | Yemen | 97.5 /100 | #123 | Exceptional 2.2% |
| British West Indians | 97.4 /100 | #124 | Exceptional 2.2% |
| Immigrants | Indonesia | 97.4 /100 | #125 | Exceptional 2.2% |
| Moroccans | 96.9 /100 | #126 | Exceptional 2.2% |
| Jordanians | 96.9 /100 | #127 | Exceptional 2.2% |
| Immigrants | England | 96.8 /100 | #128 | Exceptional 2.2% |
| Serbians | 96.8 /100 | #129 | Exceptional 2.2% |
| Immigrants | Chile | 96.7 /100 | #130 | Exceptional 2.2% |
| Immigrants | Jordan | 96.6 /100 | #131 | Exceptional 2.2% |
| Poles | 96.5 /100 | #132 | Exceptional 2.2% |
| Taiwanese | 96.3 /100 | #133 | Exceptional 2.2% |
| Zimbabweans | 95.1 /100 | #134 | Exceptional 2.2% |