Guatemalan vs Jordanian In Labor Force | Age 25-29
COMPARE
Guatemalan
Jordanian
In Labor Force | Age 25-29
In Labor Force | Age 25-29 Comparison
Guatemalans
Jordanians
83.7%
IN LABOR FORCE | AGE 25-29
0.2/ 100
METRIC RATING
252nd/ 347
METRIC RANK
84.2%
IN LABOR FORCE | AGE 25-29
6.7/ 100
METRIC RATING
222nd/ 347
METRIC RANK
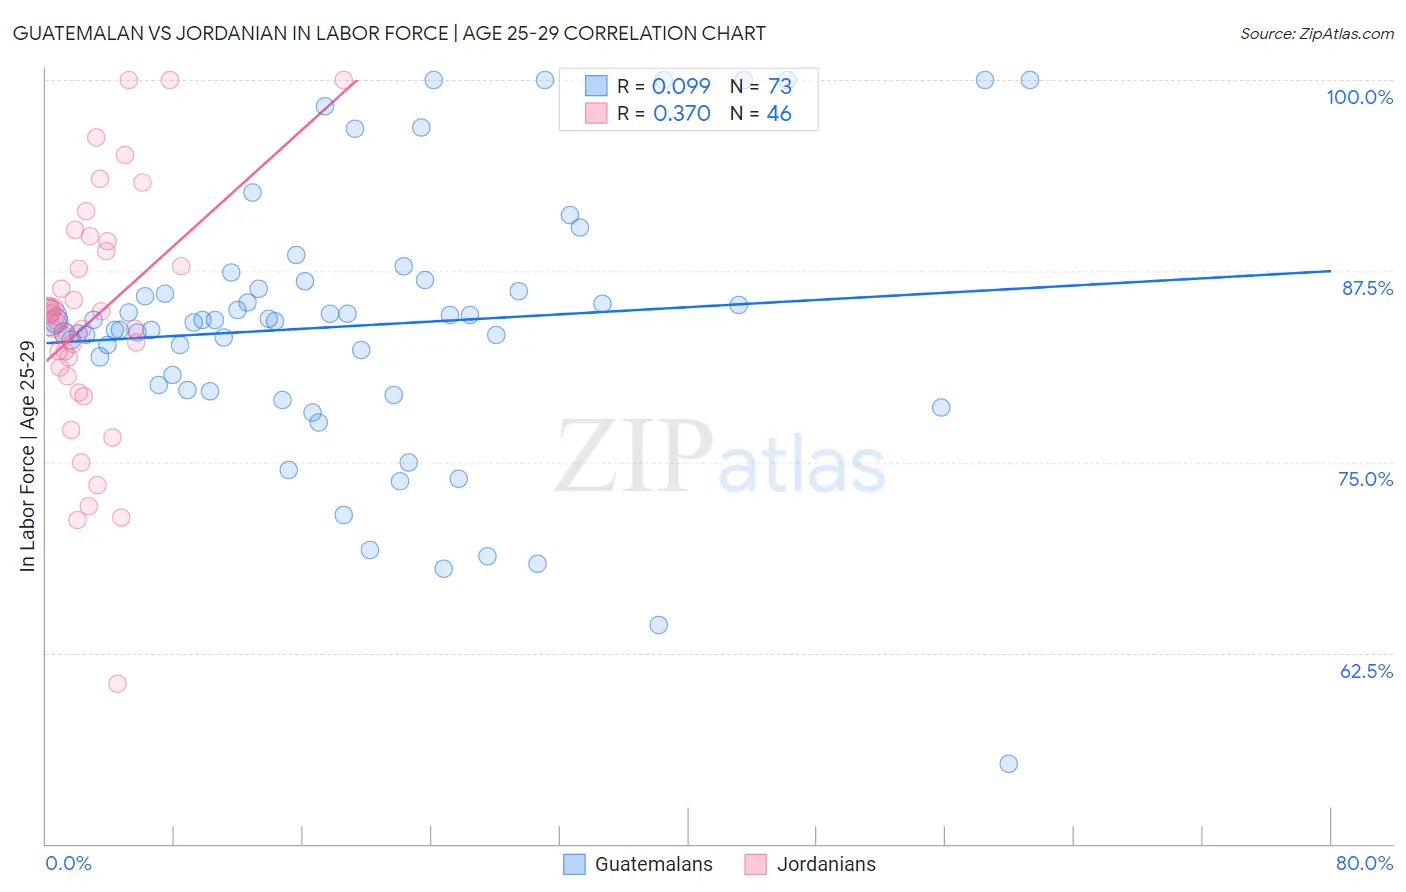
Guatemalan vs Jordanian In Labor Force | Age 25-29 Correlation Chart
The statistical analysis conducted on geographies consisting of 409,424,907 people shows a slight positive correlation between the proportion of Guatemalans and labor force participation rate among population between the ages 25 and 29 in the United States with a correlation coefficient (R) of 0.099 and weighted average of 83.7%. Similarly, the statistical analysis conducted on geographies consisting of 166,391,810 people shows a mild positive correlation between the proportion of Jordanians and labor force participation rate among population between the ages 25 and 29 in the United States with a correlation coefficient (R) of 0.370 and weighted average of 84.2%, a difference of 0.67%.
In Labor Force | Age 25-29 Correlation Summary
| Measurement | Guatemalan | Jordanian |
| Minimum | 55.2% | 60.5% |
| Maximum | 100.0% | 100.0% |
| Range | 44.8% | 39.5% |
| Mean | 83.9% | 84.4% |
| Median | 84.2% | 84.3% |
| Interquartile 25% (IQ1) | 79.9% | 81.2% |
| Interquartile 75% (IQ3) | 86.5% | 88.8% |
| Interquartile Range (IQR) | 6.7% | 7.6% |
| Standard Deviation (Sample) | 8.8% | 7.9% |
| Standard Deviation (Population) | 8.7% | 7.8% |
Similar Demographics by In Labor Force | Age 25-29
Demographics Similar to Guatemalans by In Labor Force | Age 25-29
In terms of in labor force | age 25-29, the demographic groups most similar to Guatemalans are Immigrants from Trinidad and Tobago (83.7%, a difference of 0.0%), Spaniard (83.7%, a difference of 0.0%), Bahamian (83.7%, a difference of 0.010%), Central American (83.7%, a difference of 0.020%), and Haitian (83.7%, a difference of 0.020%).
| Demographics | Rating | Rank | In Labor Force | Age 25-29 |
| Iroquois | 0.4 /100 | #245 | Tragic 83.8% |
| Cree | 0.3 /100 | #246 | Tragic 83.8% |
| Immigrants | El Salvador | 0.3 /100 | #247 | Tragic 83.7% |
| Immigrants | Nonimmigrants | 0.3 /100 | #248 | Tragic 83.7% |
| Hmong | 0.3 /100 | #249 | Tragic 83.7% |
| Central Americans | 0.2 /100 | #250 | Tragic 83.7% |
| Bahamians | 0.2 /100 | #251 | Tragic 83.7% |
| Guatemalans | 0.2 /100 | #252 | Tragic 83.7% |
| Immigrants | Trinidad and Tobago | 0.2 /100 | #253 | Tragic 83.7% |
| Spaniards | 0.2 /100 | #254 | Tragic 83.7% |
| Haitians | 0.2 /100 | #255 | Tragic 83.7% |
| Immigrants | Haiti | 0.2 /100 | #256 | Tragic 83.7% |
| Delaware | 0.2 /100 | #257 | Tragic 83.7% |
| Immigrants | Guatemala | 0.1 /100 | #258 | Tragic 83.6% |
| Spanish | 0.1 /100 | #259 | Tragic 83.6% |
Demographics Similar to Jordanians by In Labor Force | Age 25-29
In terms of in labor force | age 25-29, the demographic groups most similar to Jordanians are Arab (84.2%, a difference of 0.0%), Nigerian (84.3%, a difference of 0.010%), Scotch-Irish (84.2%, a difference of 0.010%), Immigrants from West Indies (84.2%, a difference of 0.020%), and Korean (84.2%, a difference of 0.030%).
| Demographics | Rating | Rank | In Labor Force | Age 25-29 |
| Immigrants | Syria | 10.7 /100 | #215 | Poor 84.3% |
| Israelis | 9.3 /100 | #216 | Tragic 84.3% |
| Immigrants | Ecuador | 9.3 /100 | #217 | Tragic 84.3% |
| Immigrants | Nigeria | 9.0 /100 | #218 | Tragic 84.3% |
| Immigrants | Saudi Arabia | 8.8 /100 | #219 | Tragic 84.3% |
| Nigerians | 7.2 /100 | #220 | Tragic 84.3% |
| Arabs | 6.8 /100 | #221 | Tragic 84.2% |
| Jordanians | 6.7 /100 | #222 | Tragic 84.2% |
| Scotch-Irish | 6.5 /100 | #223 | Tragic 84.2% |
| Immigrants | West Indies | 6.0 /100 | #224 | Tragic 84.2% |
| Koreans | 5.9 /100 | #225 | Tragic 84.2% |
| Immigrants | Congo | 5.8 /100 | #226 | Tragic 84.2% |
| French American Indians | 5.5 /100 | #227 | Tragic 84.2% |
| Immigrants | Panama | 5.5 /100 | #228 | Tragic 84.2% |
| Immigrants | Oceania | 5.0 /100 | #229 | Tragic 84.2% |