Ghanaian vs Immigrants from Morocco Single Father Households
COMPARE
Ghanaian
Immigrants from Morocco
Single Father Households
Single Father Households Comparison
Ghanaians
Immigrants from Morocco
2.4%
SINGLE FATHER HOUSEHOLDS
12.9/ 100
METRIC RATING
220th/ 347
METRIC RANK
2.2%
SINGLE FATHER HOUSEHOLDS
97.8/ 100
METRIC RATING
118th/ 347
METRIC RANK
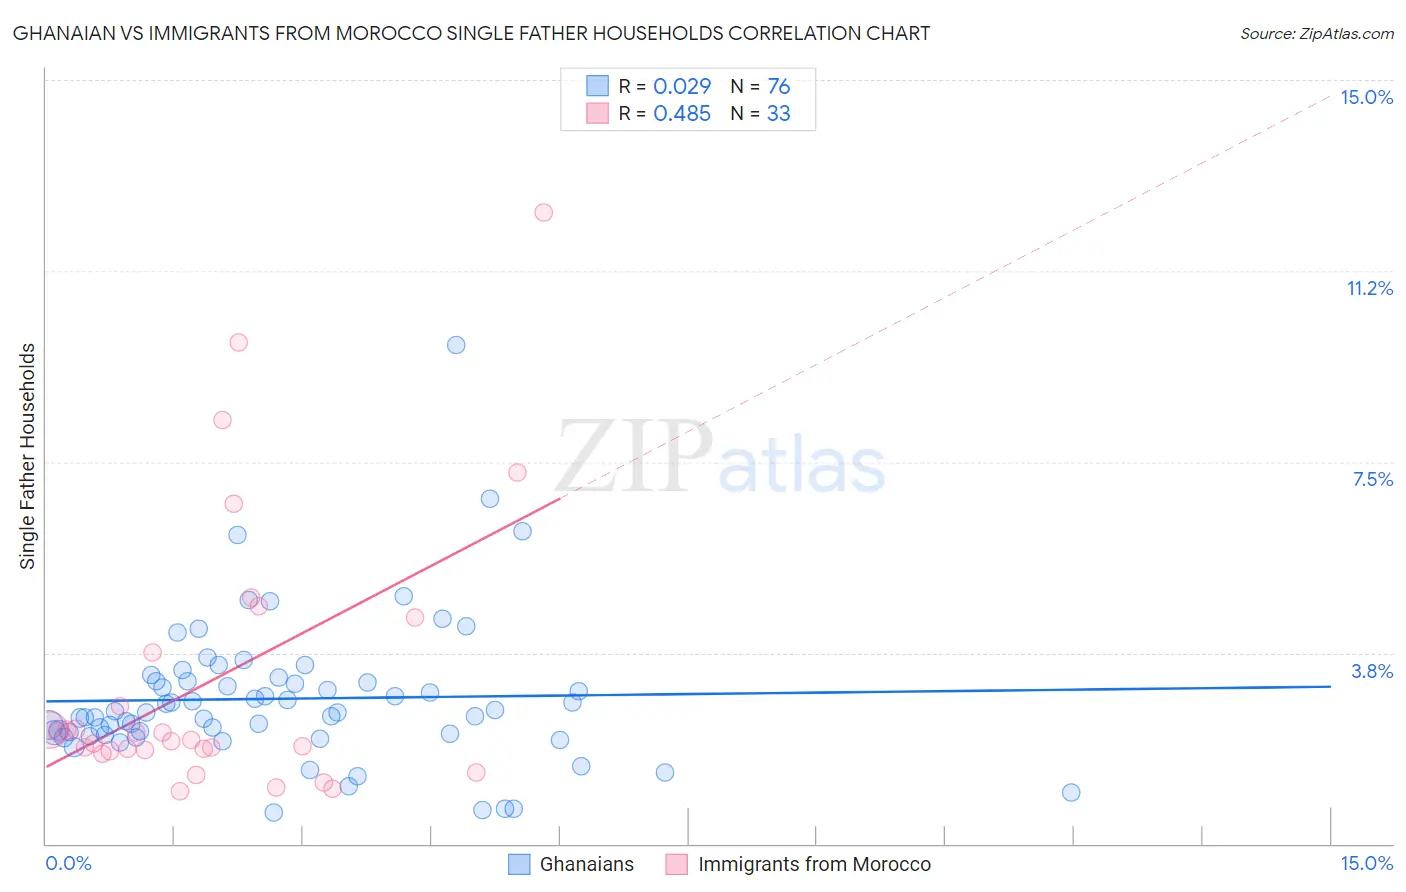
Ghanaian vs Immigrants from Morocco Single Father Households Correlation Chart
The statistical analysis conducted on geographies consisting of 189,857,222 people shows no correlation between the proportion of Ghanaians and percentage of single father households in the United States with a correlation coefficient (R) of 0.029 and weighted average of 2.4%. Similarly, the statistical analysis conducted on geographies consisting of 178,475,316 people shows a moderate positive correlation between the proportion of Immigrants from Morocco and percentage of single father households in the United States with a correlation coefficient (R) of 0.485 and weighted average of 2.2%, a difference of 11.3%.
Single Father Households Correlation Summary
| Measurement | Ghanaian | Immigrants from Morocco |
| Minimum | 0.61% | 1.0% |
| Maximum | 9.8% | 12.4% |
| Range | 9.2% | 11.4% |
| Mean | 2.8% | 3.2% |
| Median | 2.6% | 2.0% |
| Interquartile 25% (IQ1) | 2.1% | 1.8% |
| Interquartile 75% (IQ3) | 3.2% | 4.1% |
| Interquartile Range (IQR) | 1.0% | 2.3% |
| Standard Deviation (Sample) | 1.4% | 2.7% |
| Standard Deviation (Population) | 1.4% | 2.7% |
Similar Demographics by Single Father Households
Demographics Similar to Ghanaians by Single Father Households
In terms of single father households, the demographic groups most similar to Ghanaians are Sudanese (2.4%, a difference of 0.010%), Immigrants from Ethiopia (2.4%, a difference of 0.080%), Immigrants from Burma/Myanmar (2.4%, a difference of 0.13%), Immigrants from Eastern Africa (2.4%, a difference of 0.16%), and Dutch (2.4%, a difference of 0.21%).
| Demographics | Rating | Rank | Single Father Households |
| Norwegians | 17.1 /100 | #213 | Poor 2.4% |
| Ethiopians | 16.6 /100 | #214 | Poor 2.4% |
| Immigrants | South Eastern Asia | 15.9 /100 | #215 | Poor 2.4% |
| Immigrants | Ecuador | 14.9 /100 | #216 | Poor 2.4% |
| Dutch | 14.3 /100 | #217 | Poor 2.4% |
| Immigrants | Ethiopia | 13.4 /100 | #218 | Poor 2.4% |
| Sudanese | 13.0 /100 | #219 | Poor 2.4% |
| Ghanaians | 12.9 /100 | #220 | Poor 2.4% |
| Immigrants | Burma/Myanmar | 12.1 /100 | #221 | Poor 2.4% |
| Immigrants | Eastern Africa | 11.9 /100 | #222 | Poor 2.4% |
| Immigrants | Uruguay | 11.0 /100 | #223 | Poor 2.4% |
| Immigrants | Bahamas | 10.6 /100 | #224 | Poor 2.4% |
| Marshallese | 9.7 /100 | #225 | Tragic 2.4% |
| Blacks/African Americans | 9.7 /100 | #226 | Tragic 2.4% |
| Americans | 9.3 /100 | #227 | Tragic 2.4% |
Demographics Similar to Immigrants from Morocco by Single Father Households
In terms of single father households, the demographic groups most similar to Immigrants from Morocco are Trinidadian and Tobagonian (2.2%, a difference of 0.060%), Australian (2.2%, a difference of 0.090%), Immigrants from Brazil (2.2%, a difference of 0.090%), Hungarian (2.2%, a difference of 0.10%), and Immigrants from Iraq (2.2%, a difference of 0.19%).
| Demographics | Rating | Rank | Single Father Households |
| Immigrants | Canada | 98.3 /100 | #111 | Exceptional 2.2% |
| Immigrants | Trinidad and Tobago | 98.2 /100 | #112 | Exceptional 2.2% |
| Iraqis | 98.2 /100 | #113 | Exceptional 2.2% |
| Immigrants | North America | 98.2 /100 | #114 | Exceptional 2.2% |
| Immigrants | Barbados | 98.2 /100 | #115 | Exceptional 2.2% |
| Immigrants | Argentina | 98.1 /100 | #116 | Exceptional 2.2% |
| Hungarians | 97.9 /100 | #117 | Exceptional 2.2% |
| Immigrants | Morocco | 97.8 /100 | #118 | Exceptional 2.2% |
| Trinidadians and Tobagonians | 97.8 /100 | #119 | Exceptional 2.2% |
| Australians | 97.7 /100 | #120 | Exceptional 2.2% |
| Immigrants | Brazil | 97.7 /100 | #121 | Exceptional 2.2% |
| Immigrants | Iraq | 97.6 /100 | #122 | Exceptional 2.2% |
| Immigrants | Yemen | 97.5 /100 | #123 | Exceptional 2.2% |
| British West Indians | 97.4 /100 | #124 | Exceptional 2.2% |
| Immigrants | Indonesia | 97.4 /100 | #125 | Exceptional 2.2% |