Ghanaian vs Ottawa Currently Married
COMPARE
Ghanaian
Ottawa
Currently Married
Currently Married Comparison
Ghanaians
Ottawa
42.9%
CURRENTLY MARRIED
0.0/ 100
METRIC RATING
286th/ 347
METRIC RANK
46.5%
CURRENTLY MARRIED
43.0/ 100
METRIC RATING
181st/ 347
METRIC RANK
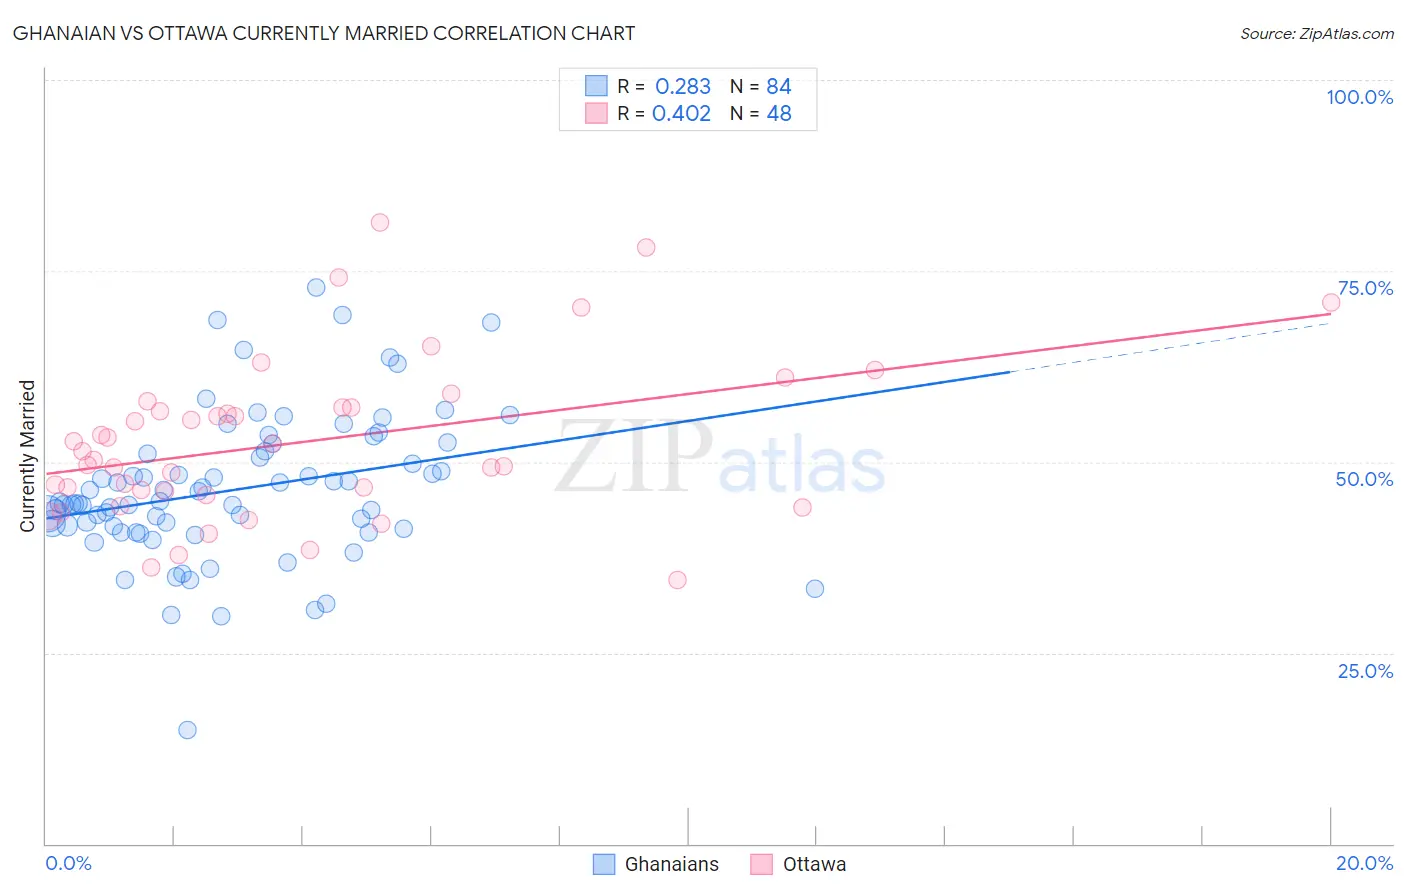
Ghanaian vs Ottawa Currently Married Correlation Chart
The statistical analysis conducted on geographies consisting of 190,682,082 people shows a weak positive correlation between the proportion of Ghanaians and percentage of population currently married in the United States with a correlation coefficient (R) of 0.283 and weighted average of 42.9%. Similarly, the statistical analysis conducted on geographies consisting of 49,956,726 people shows a moderate positive correlation between the proportion of Ottawa and percentage of population currently married in the United States with a correlation coefficient (R) of 0.402 and weighted average of 46.5%, a difference of 8.4%.
Currently Married Correlation Summary
| Measurement | Ghanaian | Ottawa |
| Minimum | 14.9% | 34.6% |
| Maximum | 72.9% | 81.4% |
| Range | 58.0% | 46.8% |
| Mean | 46.3% | 52.6% |
| Median | 44.6% | 50.9% |
| Interquartile 25% (IQ1) | 41.5% | 45.9% |
| Interquartile 75% (IQ3) | 51.2% | 57.2% |
| Interquartile Range (IQR) | 9.8% | 11.2% |
| Standard Deviation (Sample) | 9.6% | 10.5% |
| Standard Deviation (Population) | 9.6% | 10.4% |
Similar Demographics by Currently Married
Demographics Similar to Ghanaians by Currently Married
In terms of currently married, the demographic groups most similar to Ghanaians are Guatemalan (42.9%, a difference of 0.020%), Immigrants from Middle Africa (43.0%, a difference of 0.13%), Native/Alaskan (42.8%, a difference of 0.29%), Paiute (42.7%, a difference of 0.52%), and Immigrants from El Salvador (43.1%, a difference of 0.53%).
| Demographics | Rating | Rank | Currently Married |
| Central American Indians | 0.0 /100 | #279 | Tragic 43.3% |
| Apache | 0.0 /100 | #280 | Tragic 43.2% |
| Chippewa | 0.0 /100 | #281 | Tragic 43.2% |
| Immigrants | Ecuador | 0.0 /100 | #282 | Tragic 43.2% |
| Kiowa | 0.0 /100 | #283 | Tragic 43.2% |
| Immigrants | El Salvador | 0.0 /100 | #284 | Tragic 43.1% |
| Immigrants | Middle Africa | 0.0 /100 | #285 | Tragic 43.0% |
| Ghanaians | 0.0 /100 | #286 | Tragic 42.9% |
| Guatemalans | 0.0 /100 | #287 | Tragic 42.9% |
| Natives/Alaskans | 0.0 /100 | #288 | Tragic 42.8% |
| Paiute | 0.0 /100 | #289 | Tragic 42.7% |
| Immigrants | Ghana | 0.0 /100 | #290 | Tragic 42.7% |
| Immigrants | Guatemala | 0.0 /100 | #291 | Tragic 42.6% |
| Sub-Saharan Africans | 0.0 /100 | #292 | Tragic 42.6% |
| Yuman | 0.0 /100 | #293 | Tragic 42.6% |
Demographics Similar to Ottawa by Currently Married
In terms of currently married, the demographic groups most similar to Ottawa are Costa Rican (46.5%, a difference of 0.020%), Potawatomi (46.5%, a difference of 0.040%), Immigrants from Oceania (46.5%, a difference of 0.060%), Immigrants from Northern Africa (46.5%, a difference of 0.13%), and Brazilian (46.4%, a difference of 0.14%).
| Demographics | Rating | Rank | Currently Married |
| Peruvians | 50.0 /100 | #174 | Average 46.6% |
| Immigrants | Brazil | 49.9 /100 | #175 | Average 46.6% |
| Hawaiians | 48.6 /100 | #176 | Average 46.6% |
| Israelis | 48.6 /100 | #177 | Average 46.6% |
| Chickasaw | 47.8 /100 | #178 | Average 46.6% |
| Immigrants | Oceania | 44.6 /100 | #179 | Average 46.5% |
| Costa Ricans | 43.7 /100 | #180 | Average 46.5% |
| Ottawa | 43.0 /100 | #181 | Average 46.5% |
| Potawatomi | 41.9 /100 | #182 | Average 46.5% |
| Immigrants | Northern Africa | 39.7 /100 | #183 | Fair 46.5% |
| Brazilians | 39.3 /100 | #184 | Fair 46.4% |
| Mongolians | 37.6 /100 | #185 | Fair 46.4% |
| Immigrants | Chile | 36.8 /100 | #186 | Fair 46.4% |
| Immigrants | Peru | 35.3 /100 | #187 | Fair 46.4% |
| Colombians | 31.8 /100 | #188 | Fair 46.3% |