German vs Tlingit-Haida Unemployment Among Ages 60 to 64 years
COMPARE
German
Tlingit-Haida
Unemployment Among Ages 60 to 64 years
Unemployment Among Ages 60 to 64 years Comparison
Germans
Tlingit-Haida
4.5%
UNEMPLOYMENT AMONG AGES 60 TO 64 YEARS
100.0/ 100
METRIC RATING
35th/ 347
METRIC RANK
6.4%
UNEMPLOYMENT AMONG AGES 60 TO 64 YEARS
0.0/ 100
METRIC RATING
339th/ 347
METRIC RANK
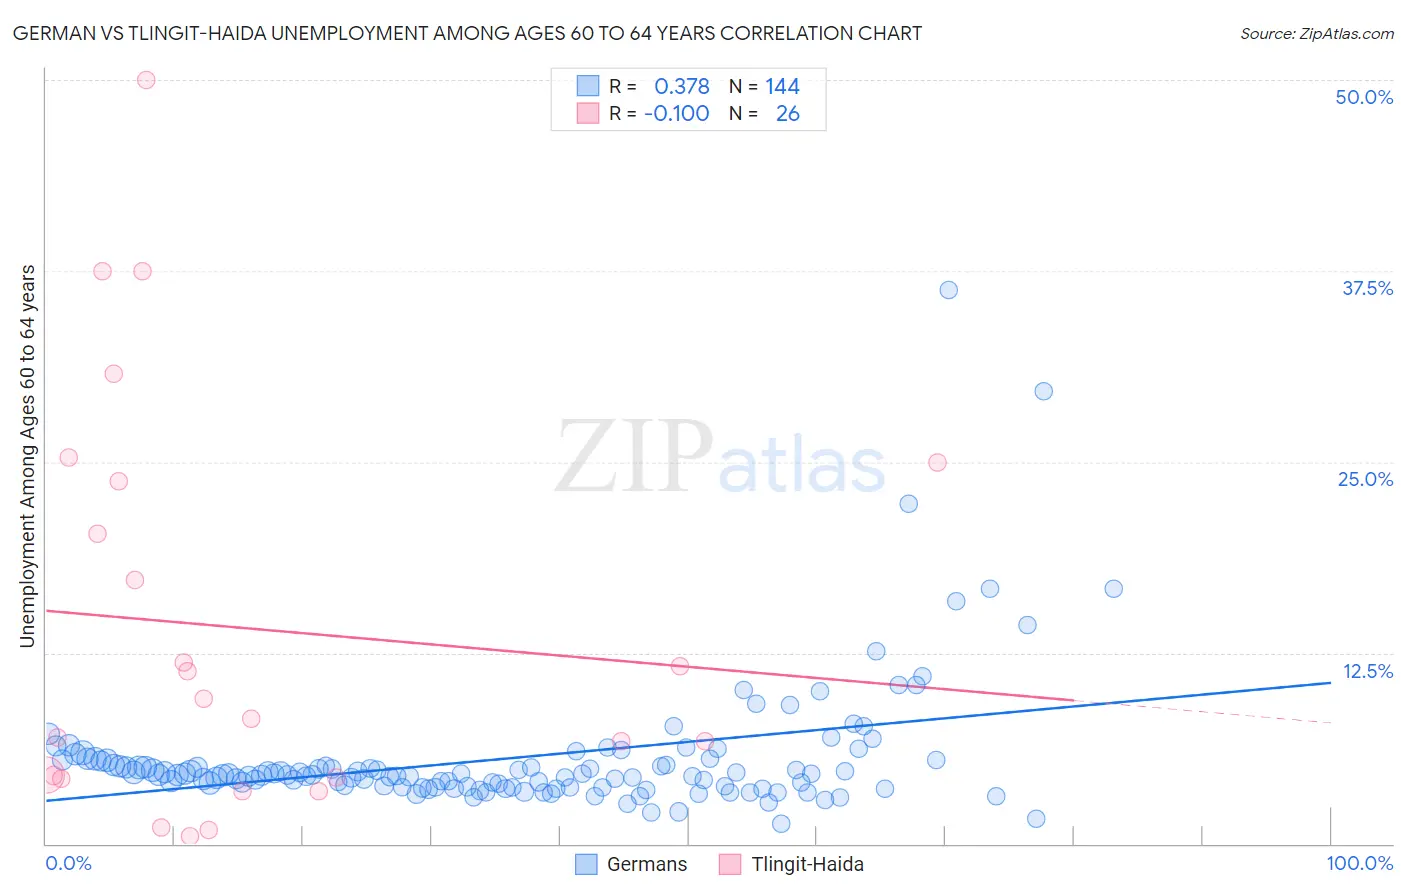
German vs Tlingit-Haida Unemployment Among Ages 60 to 64 years Correlation Chart
The statistical analysis conducted on geographies consisting of 468,686,693 people shows a mild positive correlation between the proportion of Germans and unemployment rate among population between the ages 60 and 64 in the United States with a correlation coefficient (R) of 0.378 and weighted average of 4.5%. Similarly, the statistical analysis conducted on geographies consisting of 58,290,195 people shows a slight negative correlation between the proportion of Tlingit-Haida and unemployment rate among population between the ages 60 and 64 in the United States with a correlation coefficient (R) of -0.100 and weighted average of 6.4%, a difference of 42.3%.
Unemployment Among Ages 60 to 64 years Correlation Summary
| Measurement | German | Tlingit-Haida |
| Minimum | 1.3% | 0.50% |
| Maximum | 36.3% | 50.0% |
| Range | 34.9% | 49.5% |
| Mean | 5.6% | 14.1% |
| Median | 4.5% | 8.8% |
| Interquartile 25% (IQ1) | 3.7% | 4.3% |
| Interquartile 75% (IQ3) | 5.5% | 23.7% |
| Interquartile Range (IQR) | 1.8% | 19.4% |
| Standard Deviation (Sample) | 4.4% | 13.3% |
| Standard Deviation (Population) | 4.4% | 13.0% |
Similar Demographics by Unemployment Among Ages 60 to 64 years
Demographics Similar to Germans by Unemployment Among Ages 60 to 64 years
In terms of unemployment among ages 60 to 64 years, the demographic groups most similar to Germans are Venezuelan (4.5%, a difference of 0.010%), Belgian (4.5%, a difference of 0.020%), Immigrants from Portugal (4.5%, a difference of 0.040%), Native Hawaiian (4.5%, a difference of 0.24%), and Iraqi (4.5%, a difference of 0.24%).
| Demographics | Rating | Rank | Unemployment Among Ages 60 to 64 years |
| Immigrants | Nepal | 100.0 /100 | #28 | Exceptional 4.5% |
| Cubans | 100.0 /100 | #29 | Exceptional 4.5% |
| Immigrants | Venezuela | 100.0 /100 | #30 | Exceptional 4.5% |
| Immigrants | Eritrea | 100.0 /100 | #31 | Exceptional 4.5% |
| Zimbabweans | 100.0 /100 | #32 | Exceptional 4.5% |
| Carpatho Rusyns | 100.0 /100 | #33 | Exceptional 4.5% |
| Belgians | 100.0 /100 | #34 | Exceptional 4.5% |
| Germans | 100.0 /100 | #35 | Exceptional 4.5% |
| Venezuelans | 100.0 /100 | #36 | Exceptional 4.5% |
| Immigrants | Portugal | 100.0 /100 | #37 | Exceptional 4.5% |
| Native Hawaiians | 100.0 /100 | #38 | Exceptional 4.5% |
| Iraqis | 100.0 /100 | #39 | Exceptional 4.5% |
| Scandinavians | 100.0 /100 | #40 | Exceptional 4.5% |
| Immigrants | Sudan | 100.0 /100 | #41 | Exceptional 4.5% |
| English | 100.0 /100 | #42 | Exceptional 4.5% |
Demographics Similar to Tlingit-Haida by Unemployment Among Ages 60 to 64 years
In terms of unemployment among ages 60 to 64 years, the demographic groups most similar to Tlingit-Haida are Arapaho (6.3%, a difference of 1.4%), Navajo (6.3%, a difference of 1.9%), Kiowa (6.2%, a difference of 3.0%), Vietnamese (6.1%, a difference of 5.0%), and Puerto Rican (6.1%, a difference of 5.2%).
| Demographics | Rating | Rank | Unemployment Among Ages 60 to 64 years |
| Dominicans | 0.0 /100 | #332 | Tragic 6.0% |
| Immigrants | Dominican Republic | 0.0 /100 | #333 | Tragic 6.0% |
| Puerto Ricans | 0.0 /100 | #334 | Tragic 6.1% |
| Vietnamese | 0.0 /100 | #335 | Tragic 6.1% |
| Kiowa | 0.0 /100 | #336 | Tragic 6.2% |
| Navajo | 0.0 /100 | #337 | Tragic 6.3% |
| Arapaho | 0.0 /100 | #338 | Tragic 6.3% |
| Tlingit-Haida | 0.0 /100 | #339 | Tragic 6.4% |
| Pueblo | 0.0 /100 | #340 | Tragic 6.7% |
| Yuman | 0.0 /100 | #341 | Tragic 6.8% |
| Aleuts | 0.0 /100 | #342 | Tragic 6.8% |
| Immigrants | Yemen | 0.0 /100 | #343 | Tragic 6.8% |
| Alaska Natives | 0.0 /100 | #344 | Tragic 7.6% |
| Alaskan Athabascans | 0.0 /100 | #345 | Tragic 8.4% |
| Inupiat | 0.0 /100 | #346 | Tragic 9.6% |