French Canadian vs Immigrants from Central America Births to Unmarried Women
COMPARE
French Canadian
Immigrants from Central America
Births to Unmarried Women
Births to Unmarried Women Comparison
French Canadians
Immigrants from Central America
34.4%
BIRTHS TO UNMARRIED WOMEN
2.5/ 100
METRIC RATING
232nd/ 347
METRIC RANK
37.4%
BIRTHS TO UNMARRIED WOMEN
0.0/ 100
METRIC RATING
284th/ 347
METRIC RANK
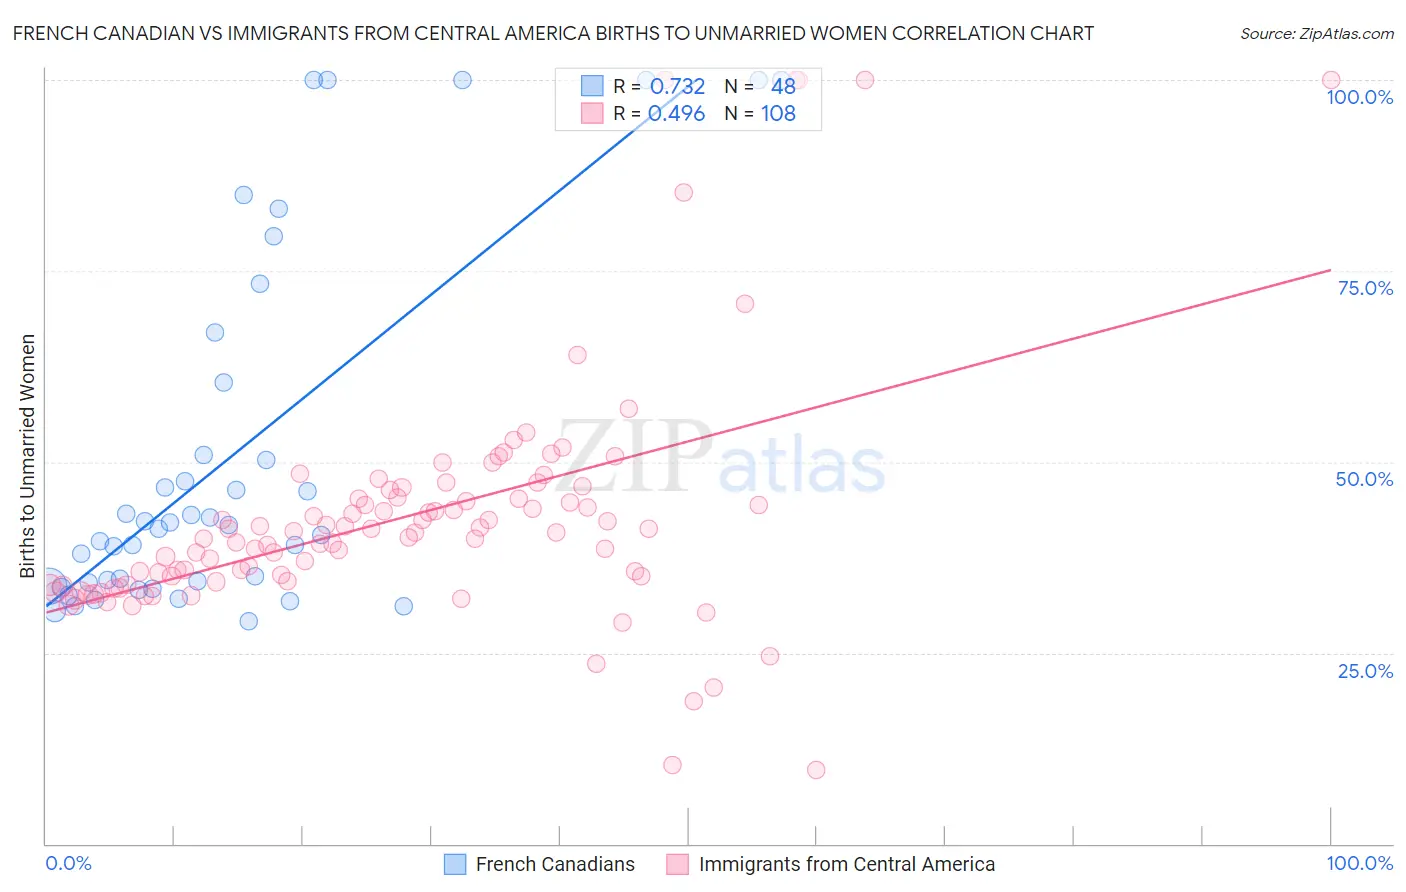
French Canadian vs Immigrants from Central America Births to Unmarried Women Correlation Chart
The statistical analysis conducted on geographies consisting of 454,698,687 people shows a strong positive correlation between the proportion of French Canadians and percentage of births to unmarried women in the United States with a correlation coefficient (R) of 0.732 and weighted average of 34.4%. Similarly, the statistical analysis conducted on geographies consisting of 486,080,403 people shows a moderate positive correlation between the proportion of Immigrants from Central America and percentage of births to unmarried women in the United States with a correlation coefficient (R) of 0.496 and weighted average of 37.4%, a difference of 8.8%.
Births to Unmarried Women Correlation Summary
| Measurement | French Canadian | Immigrants from Central America |
| Minimum | 29.1% | 9.7% |
| Maximum | 100.0% | 100.0% |
| Range | 70.9% | 90.3% |
| Mean | 50.5% | 42.8% |
| Median | 41.5% | 40.7% |
| Interquartile 25% (IQ1) | 33.9% | 34.4% |
| Interquartile 75% (IQ3) | 55.6% | 45.2% |
| Interquartile Range (IQR) | 21.7% | 10.9% |
| Standard Deviation (Sample) | 23.2% | 16.0% |
| Standard Deviation (Population) | 23.0% | 16.0% |
Similar Demographics by Births to Unmarried Women
Demographics Similar to French Canadians by Births to Unmarried Women
In terms of births to unmarried women, the demographic groups most similar to French Canadians are Bangladeshi (34.4%, a difference of 0.020%), Immigrants from Zaire (34.5%, a difference of 0.26%), Native Hawaiian (34.3%, a difference of 0.30%), Immigrants from Ghana (34.5%, a difference of 0.33%), and Ghanaian (34.3%, a difference of 0.44%).
| Demographics | Rating | Rank | Births to Unmarried Women |
| Spanish | 4.0 /100 | #225 | Tragic 34.1% |
| Delaware | 3.3 /100 | #226 | Tragic 34.2% |
| Immigrants | Panama | 3.3 /100 | #227 | Tragic 34.2% |
| Panamanians | 3.3 /100 | #228 | Tragic 34.2% |
| Immigrants | Sierra Leone | 3.1 /100 | #229 | Tragic 34.2% |
| Ghanaians | 3.1 /100 | #230 | Tragic 34.3% |
| Native Hawaiians | 2.9 /100 | #231 | Tragic 34.3% |
| French Canadians | 2.5 /100 | #232 | Tragic 34.4% |
| Bangladeshis | 2.5 /100 | #233 | Tragic 34.4% |
| Immigrants | Zaire | 2.3 /100 | #234 | Tragic 34.5% |
| Immigrants | Ghana | 2.2 /100 | #235 | Tragic 34.5% |
| Immigrants | Cameroon | 1.6 /100 | #236 | Tragic 34.7% |
| Marshallese | 1.6 /100 | #237 | Tragic 34.8% |
| Immigrants | Cambodia | 1.6 /100 | #238 | Tragic 34.8% |
| Sierra Leoneans | 1.4 /100 | #239 | Tragic 34.9% |
Demographics Similar to Immigrants from Central America by Births to Unmarried Women
In terms of births to unmarried women, the demographic groups most similar to Immigrants from Central America are Spanish American Indian (37.4%, a difference of 0.060%), Immigrants from Mexico (37.5%, a difference of 0.10%), Immigrants from Guatemala (37.5%, a difference of 0.11%), Liberian (37.4%, a difference of 0.14%), and Immigrants from Belize (37.3%, a difference of 0.31%).
| Demographics | Rating | Rank | Births to Unmarried Women |
| Guatemalans | 0.1 /100 | #277 | Tragic 37.1% |
| Immigrants | Latin America | 0.1 /100 | #278 | Tragic 37.1% |
| West Indians | 0.1 /100 | #279 | Tragic 37.3% |
| Immigrants | St. Vincent and the Grenadines | 0.1 /100 | #280 | Tragic 37.3% |
| Immigrants | Belize | 0.1 /100 | #281 | Tragic 37.3% |
| Liberians | 0.0 /100 | #282 | Tragic 37.4% |
| Spanish American Indians | 0.0 /100 | #283 | Tragic 37.4% |
| Immigrants | Central America | 0.0 /100 | #284 | Tragic 37.4% |
| Immigrants | Mexico | 0.0 /100 | #285 | Tragic 37.5% |
| Immigrants | Guatemala | 0.0 /100 | #286 | Tragic 37.5% |
| Creek | 0.0 /100 | #287 | Tragic 37.6% |
| Immigrants | Liberia | 0.0 /100 | #288 | Tragic 37.6% |
| Alaskan Athabascans | 0.0 /100 | #289 | Tragic 37.7% |
| Hispanics or Latinos | 0.0 /100 | #290 | Tragic 37.8% |
| Seminole | 0.0 /100 | #291 | Tragic 37.9% |