French Canadian vs Immigrants from Romania Births to Unmarried Women
COMPARE
French Canadian
Immigrants from Romania
Births to Unmarried Women
Births to Unmarried Women Comparison
French Canadians
Immigrants from Romania
34.4%
BIRTHS TO UNMARRIED WOMEN
2.5/ 100
METRIC RATING
232nd/ 347
METRIC RANK
27.9%
BIRTHS TO UNMARRIED WOMEN
99.4/ 100
METRIC RATING
53rd/ 347
METRIC RANK
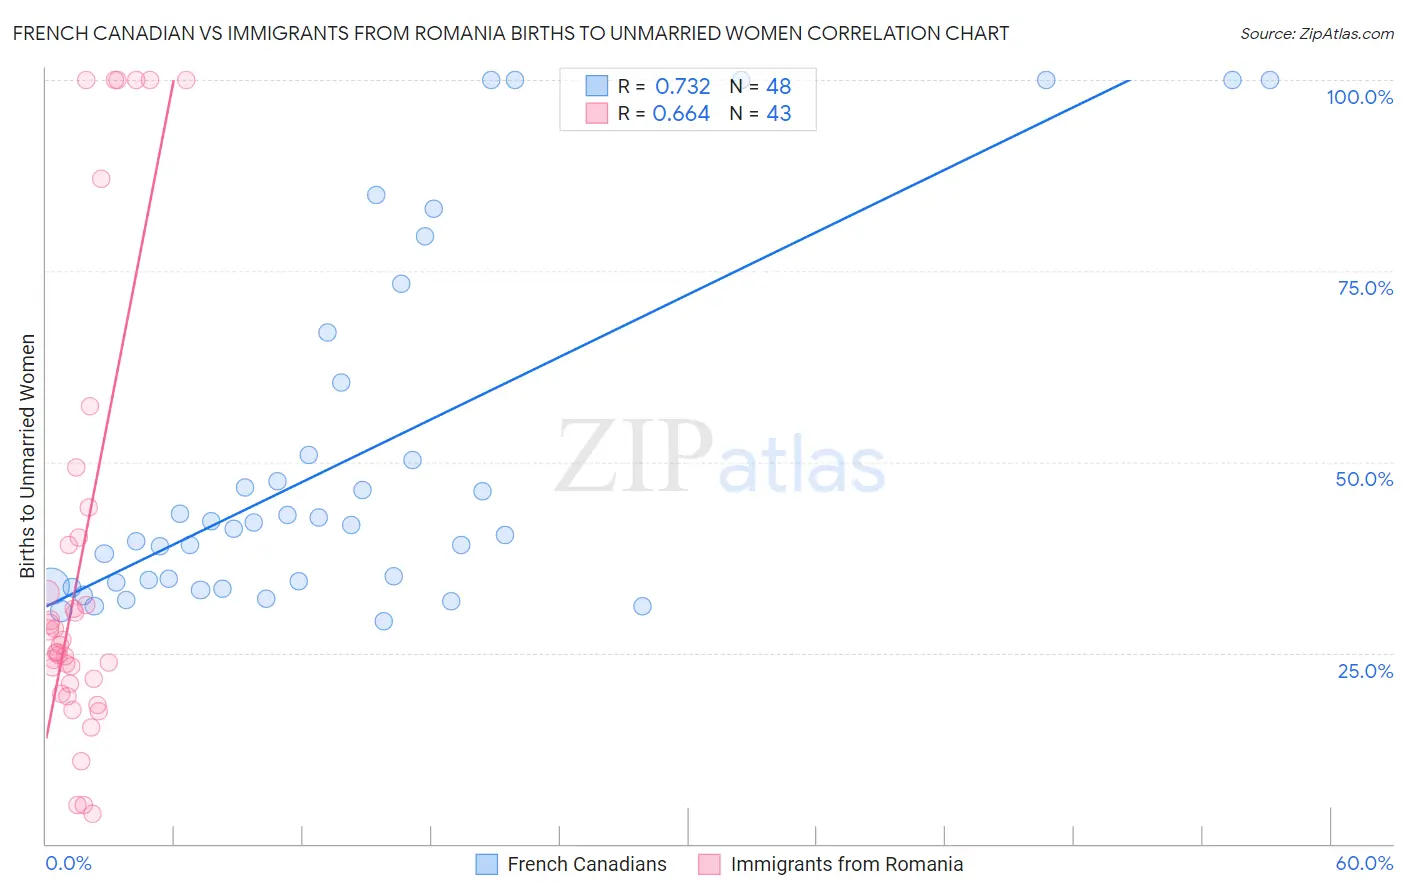
French Canadian vs Immigrants from Romania Births to Unmarried Women Correlation Chart
The statistical analysis conducted on geographies consisting of 454,698,687 people shows a strong positive correlation between the proportion of French Canadians and percentage of births to unmarried women in the United States with a correlation coefficient (R) of 0.732 and weighted average of 34.4%. Similarly, the statistical analysis conducted on geographies consisting of 242,549,897 people shows a significant positive correlation between the proportion of Immigrants from Romania and percentage of births to unmarried women in the United States with a correlation coefficient (R) of 0.664 and weighted average of 27.9%, a difference of 23.4%.
Births to Unmarried Women Correlation Summary
| Measurement | French Canadian | Immigrants from Romania |
| Minimum | 29.1% | 3.9% |
| Maximum | 100.0% | 100.0% |
| Range | 70.9% | 96.1% |
| Mean | 50.5% | 37.2% |
| Median | 41.5% | 26.1% |
| Interquartile 25% (IQ1) | 33.9% | 21.0% |
| Interquartile 75% (IQ3) | 55.6% | 40.2% |
| Interquartile Range (IQR) | 21.7% | 19.2% |
| Standard Deviation (Sample) | 23.2% | 29.1% |
| Standard Deviation (Population) | 23.0% | 28.8% |
Similar Demographics by Births to Unmarried Women
Demographics Similar to French Canadians by Births to Unmarried Women
In terms of births to unmarried women, the demographic groups most similar to French Canadians are Bangladeshi (34.4%, a difference of 0.020%), Immigrants from Zaire (34.5%, a difference of 0.26%), Native Hawaiian (34.3%, a difference of 0.30%), Immigrants from Ghana (34.5%, a difference of 0.33%), and Ghanaian (34.3%, a difference of 0.44%).
| Demographics | Rating | Rank | Births to Unmarried Women |
| Spanish | 4.0 /100 | #225 | Tragic 34.1% |
| Delaware | 3.3 /100 | #226 | Tragic 34.2% |
| Immigrants | Panama | 3.3 /100 | #227 | Tragic 34.2% |
| Panamanians | 3.3 /100 | #228 | Tragic 34.2% |
| Immigrants | Sierra Leone | 3.1 /100 | #229 | Tragic 34.2% |
| Ghanaians | 3.1 /100 | #230 | Tragic 34.3% |
| Native Hawaiians | 2.9 /100 | #231 | Tragic 34.3% |
| French Canadians | 2.5 /100 | #232 | Tragic 34.4% |
| Bangladeshis | 2.5 /100 | #233 | Tragic 34.4% |
| Immigrants | Zaire | 2.3 /100 | #234 | Tragic 34.5% |
| Immigrants | Ghana | 2.2 /100 | #235 | Tragic 34.5% |
| Immigrants | Cameroon | 1.6 /100 | #236 | Tragic 34.7% |
| Marshallese | 1.6 /100 | #237 | Tragic 34.8% |
| Immigrants | Cambodia | 1.6 /100 | #238 | Tragic 34.8% |
| Sierra Leoneans | 1.4 /100 | #239 | Tragic 34.9% |
Demographics Similar to Immigrants from Romania by Births to Unmarried Women
In terms of births to unmarried women, the demographic groups most similar to Immigrants from Romania are Bhutanese (27.9%, a difference of 0.020%), Macedonian (27.9%, a difference of 0.050%), Afghan (27.9%, a difference of 0.070%), Mongolian (27.9%, a difference of 0.11%), and Maltese (27.8%, a difference of 0.19%).
| Demographics | Rating | Rank | Births to Unmarried Women |
| Immigrants | Lithuania | 99.5 /100 | #46 | Exceptional 27.7% |
| Hmong | 99.5 /100 | #47 | Exceptional 27.7% |
| Eastern Europeans | 99.5 /100 | #48 | Exceptional 27.7% |
| Immigrants | Greece | 99.4 /100 | #49 | Exceptional 27.8% |
| Maltese | 99.4 /100 | #50 | Exceptional 27.8% |
| Macedonians | 99.4 /100 | #51 | Exceptional 27.9% |
| Bhutanese | 99.4 /100 | #52 | Exceptional 27.9% |
| Immigrants | Romania | 99.4 /100 | #53 | Exceptional 27.9% |
| Afghans | 99.4 /100 | #54 | Exceptional 27.9% |
| Mongolians | 99.3 /100 | #55 | Exceptional 27.9% |
| Immigrants | Belgium | 99.3 /100 | #56 | Exceptional 28.0% |
| Russians | 99.2 /100 | #57 | Exceptional 28.0% |
| Immigrants | Albania | 99.2 /100 | #58 | Exceptional 28.0% |
| Immigrants | Kazakhstan | 99.1 /100 | #59 | Exceptional 28.1% |
| Immigrants | Turkey | 99.1 /100 | #60 | Exceptional 28.1% |