French American Indian vs Chickasaw Average Family Size
COMPARE
French American Indian
Chickasaw
Average Family Size
Average Family Size Comparison
French American Indians
Chickasaw
3.20
AVERAGE FAMILY SIZE
9.8/ 100
METRIC RATING
218th/ 347
METRIC RANK
3.19
AVERAGE FAMILY SIZE
6.0/ 100
METRIC RATING
226th/ 347
METRIC RANK
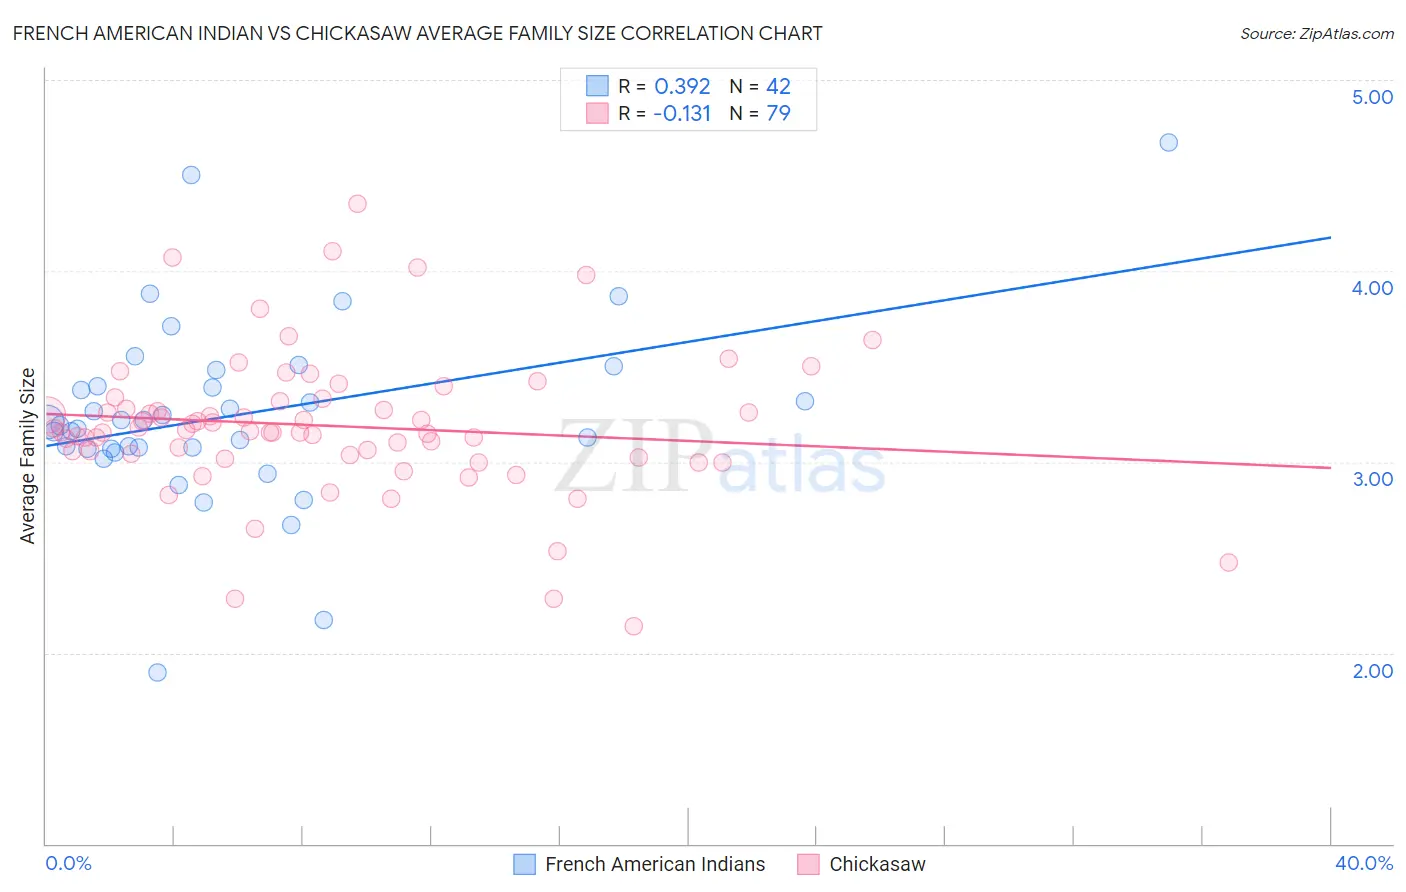
French American Indian vs Chickasaw Average Family Size Correlation Chart
The statistical analysis conducted on geographies consisting of 131,961,005 people shows a mild positive correlation between the proportion of French American Indians and average family size in the United States with a correlation coefficient (R) of 0.392 and weighted average of 3.20. Similarly, the statistical analysis conducted on geographies consisting of 147,674,515 people shows a poor negative correlation between the proportion of Chickasaw and average family size in the United States with a correlation coefficient (R) of -0.131 and weighted average of 3.19, a difference of 0.24%.
Average Family Size Correlation Summary
| Measurement | French American Indian | Chickasaw |
| Minimum | 1.90 | 2.14 |
| Maximum | 4.67 | 4.35 |
| Range | 2.77 | 2.21 |
| Mean | 3.25 | 3.19 |
| Median | 3.20 | 3.16 |
| Interquartile 25% (IQ1) | 3.07 | 3.04 |
| Interquartile 75% (IQ3) | 3.39 | 3.32 |
| Interquartile Range (IQR) | 0.33 | 0.28 |
| Standard Deviation (Sample) | 0.48 | 0.38 |
| Standard Deviation (Population) | 0.48 | 0.37 |
Demographics Similar to French American Indians and Chickasaw by Average Family Size
In terms of average family size, the demographic groups most similar to French American Indians are Immigrants from Somalia (3.20, a difference of 0.030%), Pennsylvania German (3.19, a difference of 0.030%), Lebanese (3.19, a difference of 0.040%), Delaware (3.20, a difference of 0.060%), and Bermudan (3.20, a difference of 0.060%). Similarly, the demographic groups most similar to Chickasaw are Portuguese (3.19, a difference of 0.0%), Cree (3.19, a difference of 0.020%), Nonimmigrants (3.19, a difference of 0.030%), Syrian (3.19, a difference of 0.040%), and Immigrants from Italy (3.19, a difference of 0.060%).
| Demographics | Rating | Rank | Average Family Size |
| Creek | 12.1 /100 | #212 | Poor 3.20 |
| Mongolians | 11.5 /100 | #213 | Poor 3.20 |
| Somalis | 11.2 /100 | #214 | Poor 3.20 |
| Delaware | 11.1 /100 | #215 | Poor 3.20 |
| Bermudans | 11.0 /100 | #216 | Poor 3.20 |
| Immigrants | Somalia | 10.3 /100 | #217 | Poor 3.20 |
| French American Indians | 9.8 /100 | #218 | Tragic 3.20 |
| Pennsylvania Germans | 9.3 /100 | #219 | Tragic 3.19 |
| Lebanese | 9.1 /100 | #220 | Tragic 3.19 |
| Immigrants | Ukraine | 7.2 /100 | #221 | Tragic 3.19 |
| Immigrants | Kuwait | 7.2 /100 | #222 | Tragic 3.19 |
| Immigrants | Zimbabwe | 7.1 /100 | #223 | Tragic 3.19 |
| Syrians | 6.5 /100 | #224 | Tragic 3.19 |
| Cree | 6.2 /100 | #225 | Tragic 3.19 |
| Chickasaw | 6.0 /100 | #226 | Tragic 3.19 |
| Portuguese | 6.0 /100 | #227 | Tragic 3.19 |
| Immigrants | Nonimmigrants | 5.7 /100 | #228 | Tragic 3.19 |
| Immigrants | Italy | 5.3 /100 | #229 | Tragic 3.19 |
| Icelanders | 5.2 /100 | #230 | Tragic 3.19 |
| Basques | 5.2 /100 | #231 | Tragic 3.19 |
| Cherokee | 4.7 /100 | #232 | Tragic 3.18 |