French American Indian vs Immigrants from Haiti Average Family Size
COMPARE
French American Indian
Immigrants from Haiti
Average Family Size
Average Family Size Comparison
French American Indians
Immigrants from Haiti
3.20
AVERAGE FAMILY SIZE
9.8/ 100
METRIC RATING
218th/ 347
METRIC RANK
3.39
AVERAGE FAMILY SIZE
100.0/ 100
METRIC RATING
39th/ 347
METRIC RANK
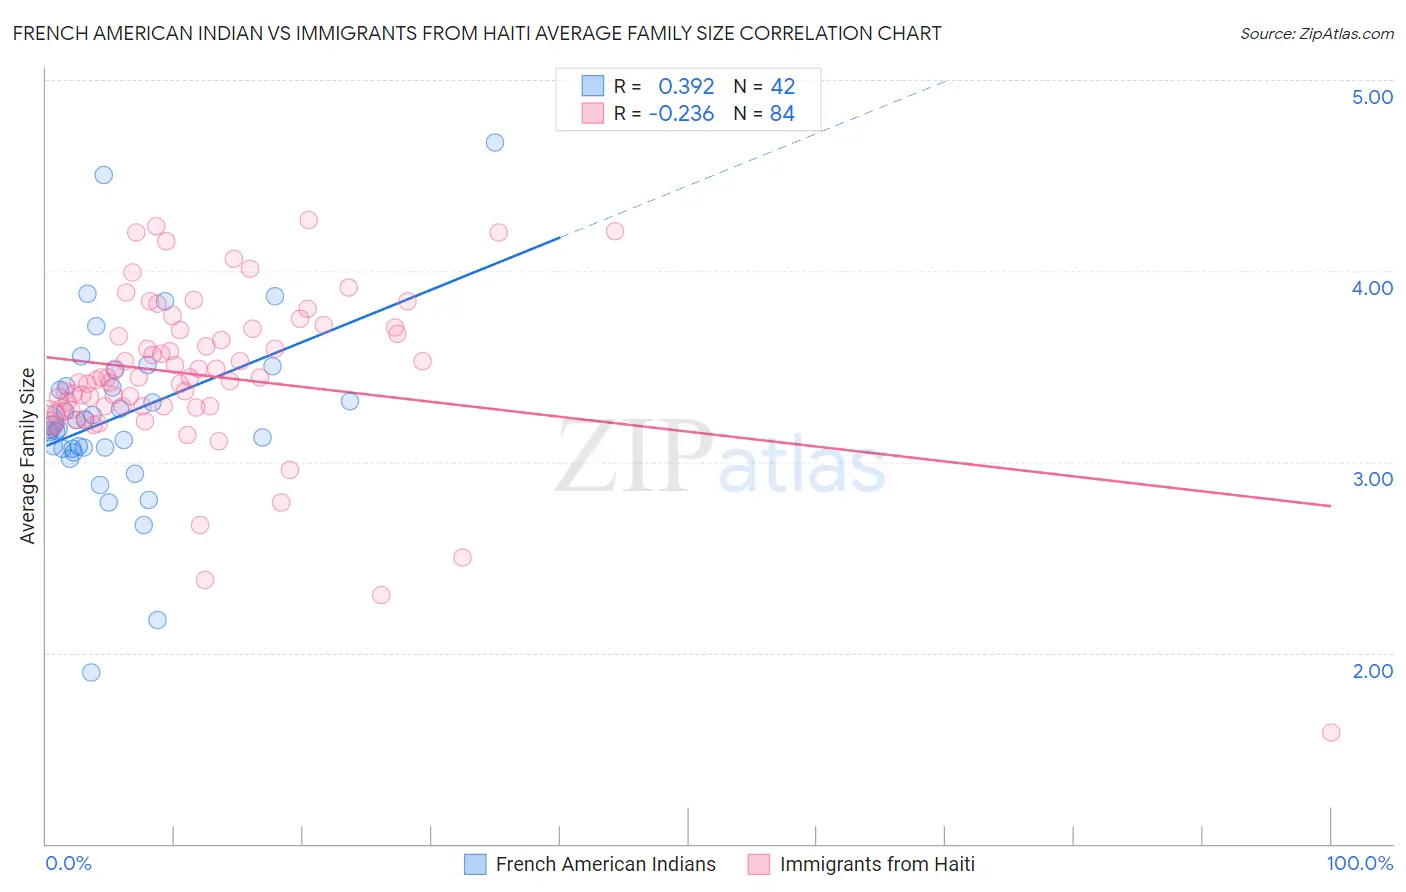
French American Indian vs Immigrants from Haiti Average Family Size Correlation Chart
The statistical analysis conducted on geographies consisting of 131,961,005 people shows a mild positive correlation between the proportion of French American Indians and average family size in the United States with a correlation coefficient (R) of 0.392 and weighted average of 3.20. Similarly, the statistical analysis conducted on geographies consisting of 225,178,087 people shows a weak negative correlation between the proportion of Immigrants from Haiti and average family size in the United States with a correlation coefficient (R) of -0.236 and weighted average of 3.39, a difference of 6.1%.
Average Family Size Correlation Summary
| Measurement | French American Indian | Immigrants from Haiti |
| Minimum | 1.90 | 1.58 |
| Maximum | 4.67 | 4.27 |
| Range | 2.77 | 2.69 |
| Mean | 3.25 | 3.45 |
| Median | 3.20 | 3.44 |
| Interquartile 25% (IQ1) | 3.07 | 3.29 |
| Interquartile 75% (IQ3) | 3.39 | 3.69 |
| Interquartile Range (IQR) | 0.33 | 0.40 |
| Standard Deviation (Sample) | 0.48 | 0.43 |
| Standard Deviation (Population) | 0.48 | 0.43 |
Similar Demographics by Average Family Size
Demographics Similar to French American Indians by Average Family Size
In terms of average family size, the demographic groups most similar to French American Indians are Immigrants from Somalia (3.20, a difference of 0.030%), Pennsylvania German (3.19, a difference of 0.030%), Lebanese (3.19, a difference of 0.040%), Delaware (3.20, a difference of 0.060%), and Bermudan (3.20, a difference of 0.060%).
| Demographics | Rating | Rank | Average Family Size |
| Immigrants | Iran | 12.1 /100 | #211 | Poor 3.20 |
| Creek | 12.1 /100 | #212 | Poor 3.20 |
| Mongolians | 11.5 /100 | #213 | Poor 3.20 |
| Somalis | 11.2 /100 | #214 | Poor 3.20 |
| Delaware | 11.1 /100 | #215 | Poor 3.20 |
| Bermudans | 11.0 /100 | #216 | Poor 3.20 |
| Immigrants | Somalia | 10.3 /100 | #217 | Poor 3.20 |
| French American Indians | 9.8 /100 | #218 | Tragic 3.20 |
| Pennsylvania Germans | 9.3 /100 | #219 | Tragic 3.19 |
| Lebanese | 9.1 /100 | #220 | Tragic 3.19 |
| Immigrants | Ukraine | 7.2 /100 | #221 | Tragic 3.19 |
| Immigrants | Kuwait | 7.2 /100 | #222 | Tragic 3.19 |
| Immigrants | Zimbabwe | 7.1 /100 | #223 | Tragic 3.19 |
| Syrians | 6.5 /100 | #224 | Tragic 3.19 |
| Cree | 6.2 /100 | #225 | Tragic 3.19 |
Demographics Similar to Immigrants from Haiti by Average Family Size
In terms of average family size, the demographic groups most similar to Immigrants from Haiti are Immigrants from Belize (3.39, a difference of 0.080%), Belizean (3.39, a difference of 0.12%), Guyanese (3.40, a difference of 0.24%), Marshallese (3.38, a difference of 0.29%), and Immigrants from Vietnam (3.38, a difference of 0.35%).
| Demographics | Rating | Rank | Average Family Size |
| Immigrants | Guatemala | 100.0 /100 | #32 | Exceptional 3.41 |
| Hawaiians | 100.0 /100 | #33 | Exceptional 3.41 |
| Hispanics or Latinos | 100.0 /100 | #34 | Exceptional 3.41 |
| Guatemalans | 100.0 /100 | #35 | Exceptional 3.40 |
| Immigrants | Guyana | 100.0 /100 | #36 | Exceptional 3.40 |
| Guyanese | 100.0 /100 | #37 | Exceptional 3.40 |
| Immigrants | Belize | 100.0 /100 | #38 | Exceptional 3.39 |
| Immigrants | Haiti | 100.0 /100 | #39 | Exceptional 3.39 |
| Belizeans | 100.0 /100 | #40 | Exceptional 3.39 |
| Marshallese | 100.0 /100 | #41 | Exceptional 3.38 |
| Immigrants | Vietnam | 100.0 /100 | #42 | Exceptional 3.38 |
| Immigrants | Philippines | 100.0 /100 | #43 | Exceptional 3.37 |
| Alaska Natives | 100.0 /100 | #44 | Exceptional 3.37 |
| Shoshone | 100.0 /100 | #45 | Exceptional 3.37 |
| Haitians | 100.0 /100 | #46 | Exceptional 3.37 |