Immigrants from Middle Africa vs Immigrants from Netherlands Family Households
COMPARE
Immigrants from Middle Africa
Immigrants from Netherlands
Family Households
Family Households Comparison
Immigrants from Middle Africa
Immigrants from Netherlands
61.9%
FAMILY HOUSEHOLDS
0.0/ 100
METRIC RATING
316th/ 347
METRIC RANK
63.8%
FAMILY HOUSEHOLDS
9.4/ 100
METRIC RATING
212th/ 347
METRIC RANK
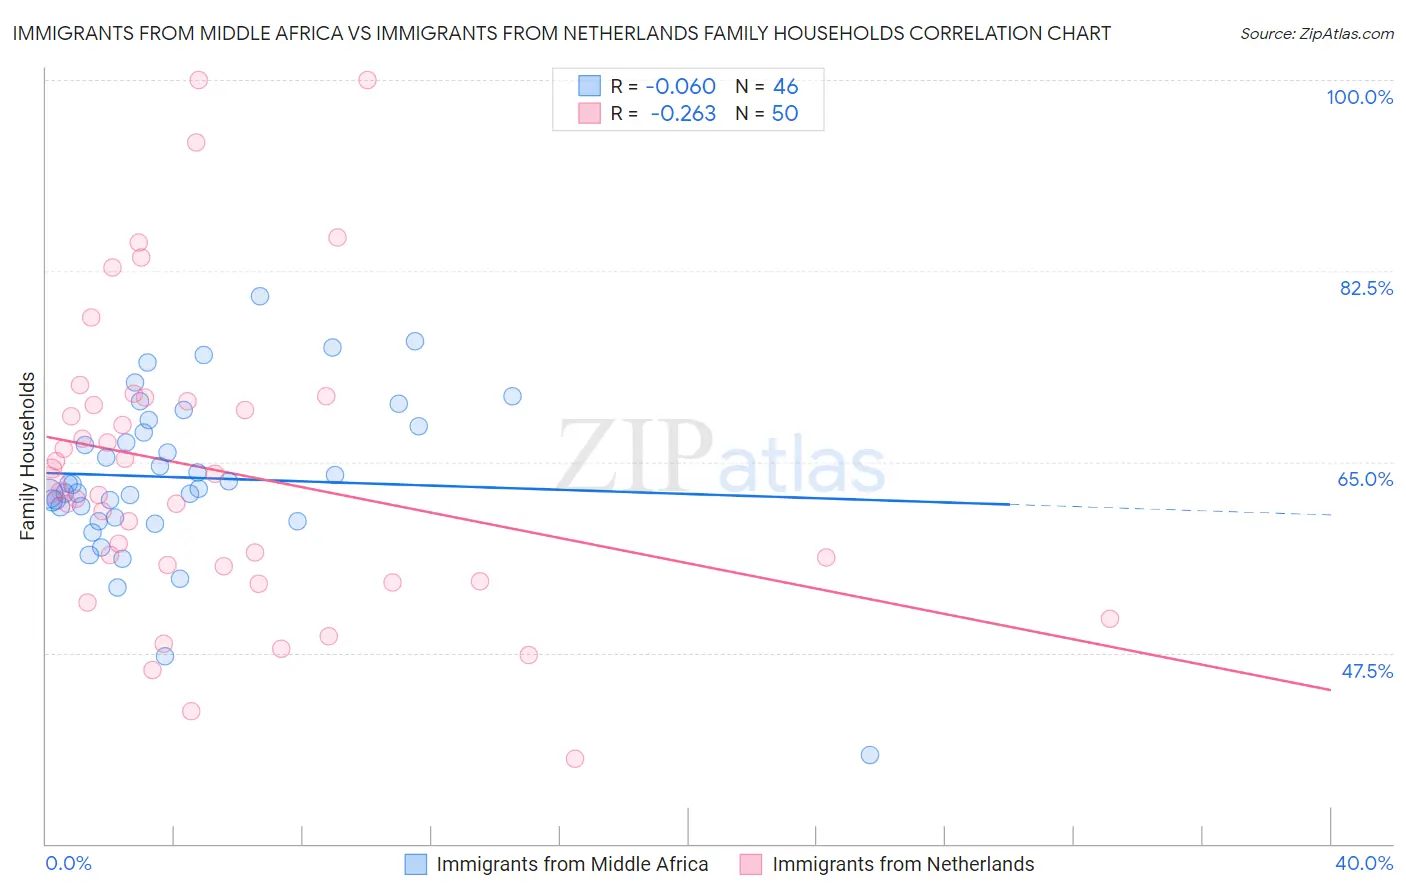
Immigrants from Middle Africa vs Immigrants from Netherlands Family Households Correlation Chart
The statistical analysis conducted on geographies consisting of 202,657,833 people shows a slight negative correlation between the proportion of Immigrants from Middle Africa and percentage of family households in the United States with a correlation coefficient (R) of -0.060 and weighted average of 61.9%. Similarly, the statistical analysis conducted on geographies consisting of 237,802,006 people shows a weak negative correlation between the proportion of Immigrants from Netherlands and percentage of family households in the United States with a correlation coefficient (R) of -0.263 and weighted average of 63.8%, a difference of 3.1%.
Family Households Correlation Summary
| Measurement | Immigrants from Middle Africa | Immigrants from Netherlands |
| Minimum | 38.1% | 37.8% |
| Maximum | 80.2% | 100.0% |
| Range | 42.1% | 62.2% |
| Mean | 63.6% | 64.3% |
| Median | 62.7% | 62.6% |
| Interquartile 25% (IQ1) | 60.0% | 55.5% |
| Interquartile 75% (IQ3) | 68.3% | 70.6% |
| Interquartile Range (IQR) | 8.4% | 15.1% |
| Standard Deviation (Sample) | 7.5% | 13.8% |
| Standard Deviation (Population) | 7.5% | 13.6% |
Similar Demographics by Family Households
Demographics Similar to Immigrants from Middle Africa by Family Households
In terms of family households, the demographic groups most similar to Immigrants from Middle Africa are Moroccan (61.9%, a difference of 0.040%), Immigrants from Bosnia and Herzegovina (61.9%, a difference of 0.040%), Immigrants from Cabo Verde (61.9%, a difference of 0.080%), Alaskan Athabascan (61.8%, a difference of 0.12%), and Liberian (62.0%, a difference of 0.13%).
| Demographics | Rating | Rank | Family Households |
| Sub-Saharan Africans | 0.0 /100 | #309 | Tragic 62.1% |
| Immigrants | Liberia | 0.0 /100 | #310 | Tragic 62.0% |
| Immigrants | Morocco | 0.0 /100 | #311 | Tragic 62.0% |
| Immigrants | Latvia | 0.0 /100 | #312 | Tragic 62.0% |
| Liberians | 0.0 /100 | #313 | Tragic 62.0% |
| Immigrants | Cabo Verde | 0.0 /100 | #314 | Tragic 61.9% |
| Moroccans | 0.0 /100 | #315 | Tragic 61.9% |
| Immigrants | Middle Africa | 0.0 /100 | #316 | Tragic 61.9% |
| Immigrants | Bosnia and Herzegovina | 0.0 /100 | #317 | Tragic 61.9% |
| Alaskan Athabascans | 0.0 /100 | #318 | Tragic 61.8% |
| Cape Verdeans | 0.0 /100 | #319 | Tragic 61.8% |
| Ugandans | 0.0 /100 | #320 | Tragic 61.7% |
| Alsatians | 0.0 /100 | #321 | Tragic 61.7% |
| Immigrants | Serbia | 0.0 /100 | #322 | Tragic 61.6% |
| Tlingit-Haida | 0.0 /100 | #323 | Tragic 61.6% |
Demographics Similar to Immigrants from Netherlands by Family Households
In terms of family households, the demographic groups most similar to Immigrants from Netherlands are Shoshone (63.8%, a difference of 0.0%), Immigrants from Thailand (63.8%, a difference of 0.010%), Immigrants from Northern Europe (63.8%, a difference of 0.020%), Celtic (63.8%, a difference of 0.060%), and Nigerian (63.9%, a difference of 0.070%).
| Demographics | Rating | Rank | Family Households |
| Brazilians | 12.4 /100 | #205 | Poor 63.9% |
| Immigrants | Lithuania | 12.1 /100 | #206 | Poor 63.9% |
| Nigerians | 11.5 /100 | #207 | Poor 63.9% |
| Immigrants | Bangladesh | 11.4 /100 | #208 | Poor 63.9% |
| Sierra Leoneans | 11.2 /100 | #209 | Poor 63.9% |
| Immigrants | Thailand | 9.6 /100 | #210 | Tragic 63.8% |
| Shoshone | 9.4 /100 | #211 | Tragic 63.8% |
| Immigrants | Netherlands | 9.4 /100 | #212 | Tragic 63.8% |
| Immigrants | Northern Europe | 8.8 /100 | #213 | Tragic 63.8% |
| Celtics | 8.0 /100 | #214 | Tragic 63.8% |
| Belgians | 7.6 /100 | #215 | Tragic 63.8% |
| Croatians | 7.3 /100 | #216 | Tragic 63.8% |
| Osage | 7.0 /100 | #217 | Tragic 63.7% |
| Marshallese | 6.9 /100 | #218 | Tragic 63.7% |
| Macedonians | 6.5 /100 | #219 | Tragic 63.7% |