Sudanese vs Immigrants from Netherlands Family Households
COMPARE
Sudanese
Immigrants from Netherlands
Family Households
Family Households Comparison
Sudanese
Immigrants from Netherlands
60.0%
FAMILY HOUSEHOLDS
0.0/ 100
METRIC RATING
342nd/ 347
METRIC RANK
63.8%
FAMILY HOUSEHOLDS
9.4/ 100
METRIC RATING
212th/ 347
METRIC RANK
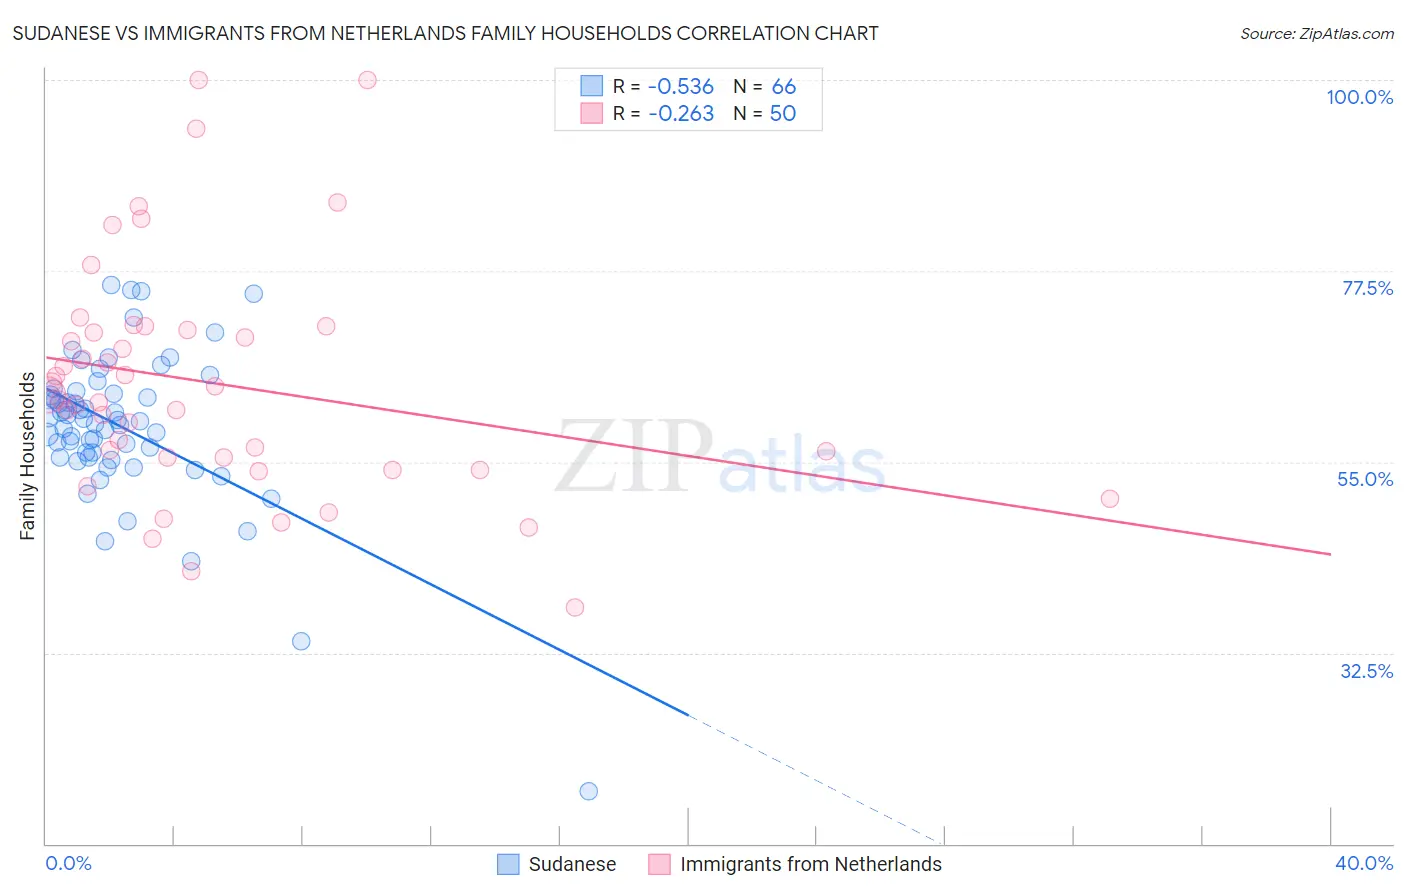
Sudanese vs Immigrants from Netherlands Family Households Correlation Chart
The statistical analysis conducted on geographies consisting of 110,109,646 people shows a substantial negative correlation between the proportion of Sudanese and percentage of family households in the United States with a correlation coefficient (R) of -0.536 and weighted average of 60.0%. Similarly, the statistical analysis conducted on geographies consisting of 237,802,006 people shows a weak negative correlation between the proportion of Immigrants from Netherlands and percentage of family households in the United States with a correlation coefficient (R) of -0.263 and weighted average of 63.8%, a difference of 6.4%.
Family Households Correlation Summary
| Measurement | Sudanese | Immigrants from Netherlands |
| Minimum | 16.3% | 37.8% |
| Maximum | 75.8% | 100.0% |
| Range | 59.6% | 62.2% |
| Mean | 59.1% | 64.3% |
| Median | 59.9% | 62.6% |
| Interquartile 25% (IQ1) | 55.6% | 55.5% |
| Interquartile 75% (IQ3) | 63.0% | 70.6% |
| Interquartile Range (IQR) | 7.4% | 15.1% |
| Standard Deviation (Sample) | 9.2% | 13.8% |
| Standard Deviation (Population) | 9.1% | 13.6% |
Similar Demographics by Family Households
Demographics Similar to Sudanese by Family Households
In terms of family households, the demographic groups most similar to Sudanese are Immigrants from Senegal (60.1%, a difference of 0.18%), Immigrants from Sudan (60.2%, a difference of 0.27%), Senegalese (59.8%, a difference of 0.30%), Immigrants from Saudi Arabia (60.7%, a difference of 1.2%), and Immigrants from Congo (59.2%, a difference of 1.3%).
| Demographics | Rating | Rank | Family Households |
| Immigrants | Ethiopia | 0.0 /100 | #333 | Tragic 61.2% |
| Immigrants | Eastern Africa | 0.0 /100 | #334 | Tragic 61.1% |
| Carpatho Rusyns | 0.0 /100 | #335 | Tragic 61.1% |
| German Russians | 0.0 /100 | #336 | Tragic 60.9% |
| Soviet Union | 0.0 /100 | #337 | Tragic 60.9% |
| Immigrants | Eritrea | 0.0 /100 | #338 | Tragic 60.8% |
| Immigrants | Saudi Arabia | 0.0 /100 | #339 | Tragic 60.7% |
| Immigrants | Sudan | 0.0 /100 | #340 | Tragic 60.2% |
| Immigrants | Senegal | 0.0 /100 | #341 | Tragic 60.1% |
| Sudanese | 0.0 /100 | #342 | Tragic 60.0% |
| Senegalese | 0.0 /100 | #343 | Tragic 59.8% |
| Immigrants | Congo | 0.0 /100 | #344 | Tragic 59.2% |
| Immigrants | Zaire | 0.0 /100 | #345 | Tragic 59.2% |
| Somalis | 0.0 /100 | #346 | Tragic 57.6% |
| Immigrants | Somalia | 0.0 /100 | #347 | Tragic 56.7% |
Demographics Similar to Immigrants from Netherlands by Family Households
In terms of family households, the demographic groups most similar to Immigrants from Netherlands are Shoshone (63.8%, a difference of 0.0%), Immigrants from Thailand (63.8%, a difference of 0.010%), Immigrants from Northern Europe (63.8%, a difference of 0.020%), Celtic (63.8%, a difference of 0.060%), and Nigerian (63.9%, a difference of 0.070%).
| Demographics | Rating | Rank | Family Households |
| Brazilians | 12.4 /100 | #205 | Poor 63.9% |
| Immigrants | Lithuania | 12.1 /100 | #206 | Poor 63.9% |
| Nigerians | 11.5 /100 | #207 | Poor 63.9% |
| Immigrants | Bangladesh | 11.4 /100 | #208 | Poor 63.9% |
| Sierra Leoneans | 11.2 /100 | #209 | Poor 63.9% |
| Immigrants | Thailand | 9.6 /100 | #210 | Tragic 63.8% |
| Shoshone | 9.4 /100 | #211 | Tragic 63.8% |
| Immigrants | Netherlands | 9.4 /100 | #212 | Tragic 63.8% |
| Immigrants | Northern Europe | 8.8 /100 | #213 | Tragic 63.8% |
| Celtics | 8.0 /100 | #214 | Tragic 63.8% |
| Belgians | 7.6 /100 | #215 | Tragic 63.8% |
| Croatians | 7.3 /100 | #216 | Tragic 63.8% |
| Osage | 7.0 /100 | #217 | Tragic 63.7% |
| Marshallese | 6.9 /100 | #218 | Tragic 63.7% |
| Macedonians | 6.5 /100 | #219 | Tragic 63.7% |