Immigrants from Austria vs Immigrants from Morocco Divorced or Separated
COMPARE
Immigrants from Austria
Immigrants from Morocco
Divorced or Separated
Divorced or Separated Comparison
Immigrants from Austria
Immigrants from Morocco
11.8%
DIVORCED OR SEPARATED
88.2/ 100
METRIC RATING
130th/ 347
METRIC RANK
11.9%
DIVORCED OR SEPARATED
82.9/ 100
METRIC RATING
141st/ 347
METRIC RANK
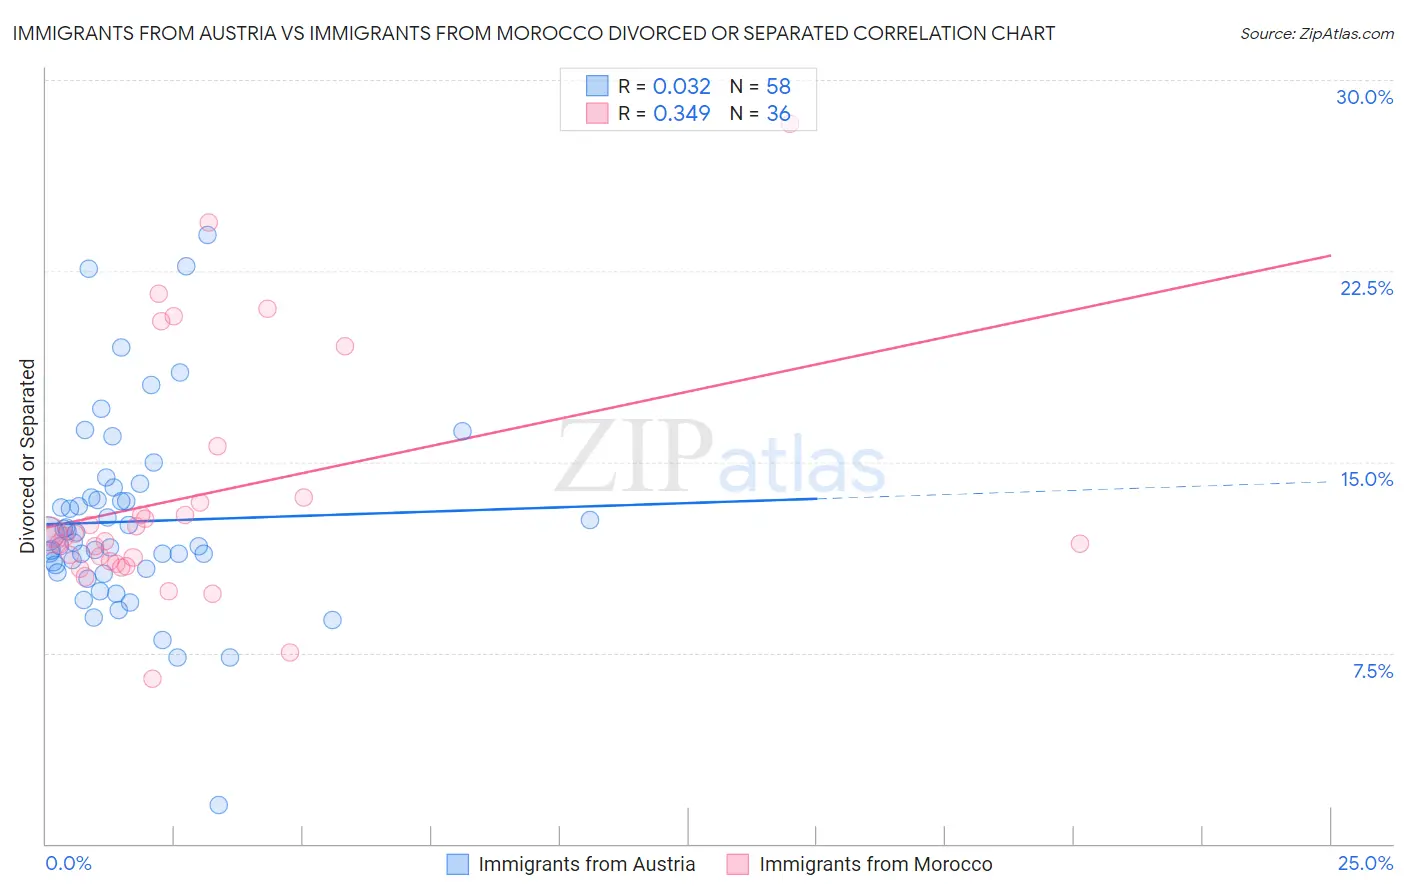
Immigrants from Austria vs Immigrants from Morocco Divorced or Separated Correlation Chart
The statistical analysis conducted on geographies consisting of 167,967,636 people shows no correlation between the proportion of Immigrants from Austria and percentage of population currently divorced or separated in the United States with a correlation coefficient (R) of 0.032 and weighted average of 11.8%. Similarly, the statistical analysis conducted on geographies consisting of 178,911,548 people shows a mild positive correlation between the proportion of Immigrants from Morocco and percentage of population currently divorced or separated in the United States with a correlation coefficient (R) of 0.349 and weighted average of 11.9%, a difference of 0.38%.
Divorced or Separated Correlation Summary
| Measurement | Immigrants from Austria | Immigrants from Morocco |
| Minimum | 1.5% | 6.5% |
| Maximum | 23.9% | 28.3% |
| Range | 22.4% | 21.8% |
| Mean | 12.7% | 13.6% |
| Median | 12.0% | 12.1% |
| Interquartile 25% (IQ1) | 10.8% | 11.0% |
| Interquartile 75% (IQ3) | 13.6% | 13.5% |
| Interquartile Range (IQR) | 2.8% | 2.5% |
| Standard Deviation (Sample) | 3.8% | 4.8% |
| Standard Deviation (Population) | 3.8% | 4.7% |
Demographics Similar to Immigrants from Austria and Immigrants from Morocco by Divorced or Separated
In terms of divorced or separated, the demographic groups most similar to Immigrants from Austria are Immigrants from Cambodia (11.8%, a difference of 0.0%), Immigrants from St. Vincent and the Grenadines (11.8%, a difference of 0.010%), Immigrants from Afghanistan (11.8%, a difference of 0.030%), Immigrants from Ecuador (11.8%, a difference of 0.050%), and South African (11.8%, a difference of 0.060%). Similarly, the demographic groups most similar to Immigrants from Morocco are Lebanese (11.9%, a difference of 0.030%), Australian (11.9%, a difference of 0.050%), Immigrants from Netherlands (11.9%, a difference of 0.060%), Alsatian (11.9%, a difference of 0.070%), and Immigrants from Zimbabwe (11.9%, a difference of 0.090%).
| Demographics | Rating | Rank | Divorced or Separated |
| Ukrainians | 92.3 /100 | #125 | Exceptional 11.8% |
| South American Indians | 92.1 /100 | #126 | Exceptional 11.8% |
| South Africans | 88.9 /100 | #127 | Excellent 11.8% |
| Immigrants | Ecuador | 88.9 /100 | #128 | Excellent 11.8% |
| Immigrants | St. Vincent and the Grenadines | 88.4 /100 | #129 | Excellent 11.8% |
| Immigrants | Austria | 88.2 /100 | #130 | Excellent 11.8% |
| Immigrants | Cambodia | 88.2 /100 | #131 | Excellent 11.8% |
| Immigrants | Afghanistan | 87.9 /100 | #132 | Excellent 11.8% |
| New Zealanders | 87.5 /100 | #133 | Excellent 11.9% |
| Argentineans | 85.1 /100 | #134 | Excellent 11.9% |
| Danes | 84.8 /100 | #135 | Excellent 11.9% |
| Carpatho Rusyns | 84.8 /100 | #136 | Excellent 11.9% |
| Alsatians | 84.0 /100 | #137 | Excellent 11.9% |
| Immigrants | Netherlands | 83.9 /100 | #138 | Excellent 11.9% |
| Australians | 83.6 /100 | #139 | Excellent 11.9% |
| Lebanese | 83.4 /100 | #140 | Excellent 11.9% |
| Immigrants | Morocco | 82.9 /100 | #141 | Excellent 11.9% |
| Immigrants | Zimbabwe | 81.5 /100 | #142 | Excellent 11.9% |
| Pakistanis | 81.3 /100 | #143 | Excellent 11.9% |
| Peruvians | 80.9 /100 | #144 | Excellent 11.9% |
| Croatians | 80.6 /100 | #145 | Excellent 11.9% |