Nicaraguan vs Immigrants from Morocco Divorced or Separated
COMPARE
Nicaraguan
Immigrants from Morocco
Divorced or Separated
Divorced or Separated Comparison
Nicaraguans
Immigrants from Morocco
13.0%
DIVORCED OR SEPARATED
0.0/ 100
METRIC RATING
296th/ 347
METRIC RANK
11.9%
DIVORCED OR SEPARATED
82.9/ 100
METRIC RATING
141st/ 347
METRIC RANK
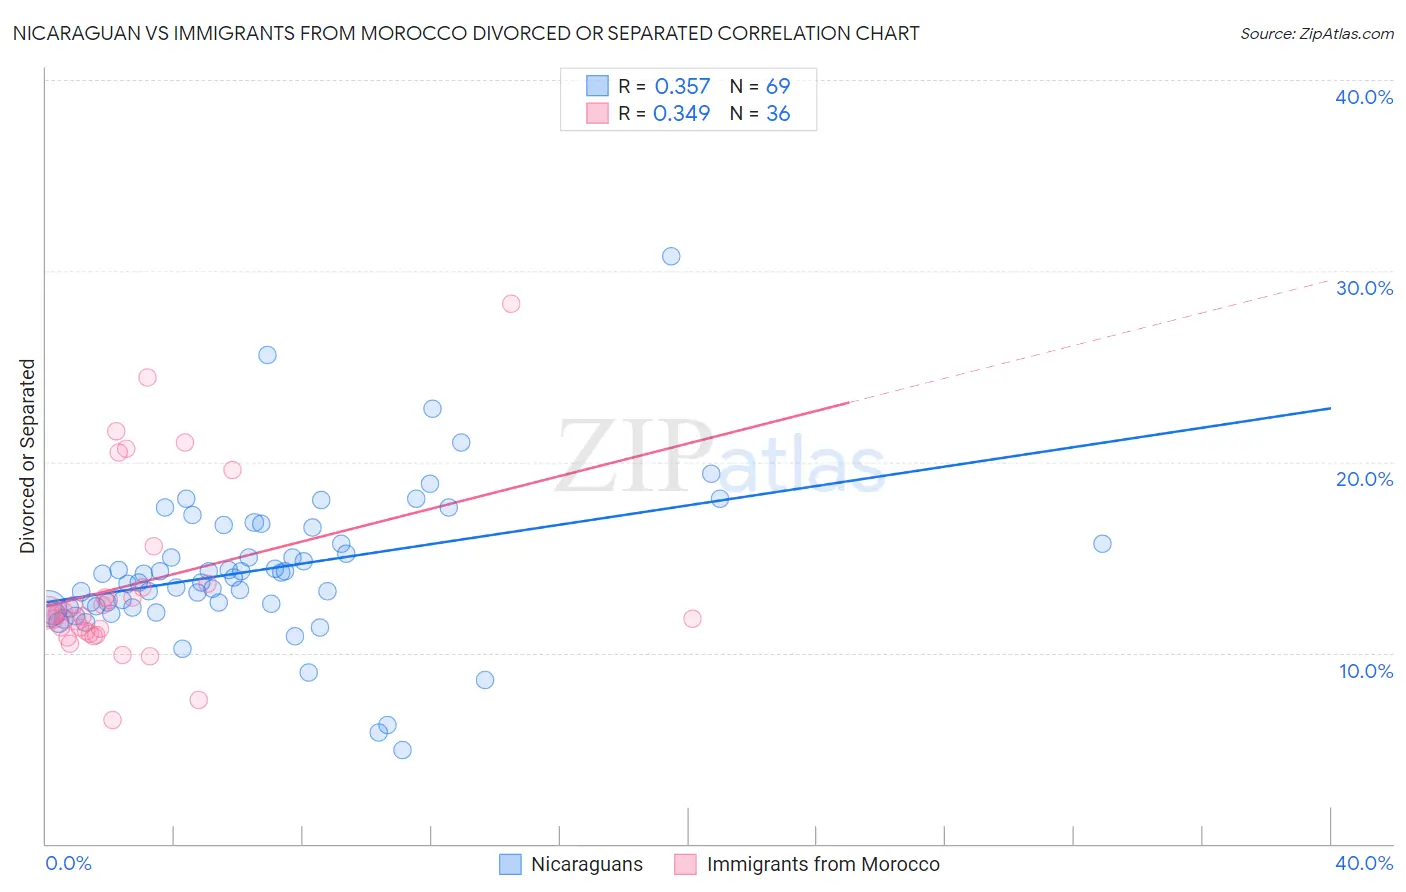
Nicaraguan vs Immigrants from Morocco Divorced or Separated Correlation Chart
The statistical analysis conducted on geographies consisting of 285,619,743 people shows a mild positive correlation between the proportion of Nicaraguans and percentage of population currently divorced or separated in the United States with a correlation coefficient (R) of 0.357 and weighted average of 13.0%. Similarly, the statistical analysis conducted on geographies consisting of 178,911,548 people shows a mild positive correlation between the proportion of Immigrants from Morocco and percentage of population currently divorced or separated in the United States with a correlation coefficient (R) of 0.349 and weighted average of 11.9%, a difference of 9.4%.
Divorced or Separated Correlation Summary
| Measurement | Nicaraguan | Immigrants from Morocco |
| Minimum | 4.9% | 6.5% |
| Maximum | 30.8% | 28.3% |
| Range | 25.9% | 21.8% |
| Mean | 14.3% | 13.6% |
| Median | 13.9% | 12.1% |
| Interquartile 25% (IQ1) | 12.4% | 11.0% |
| Interquartile 75% (IQ3) | 16.1% | 13.5% |
| Interquartile Range (IQR) | 3.8% | 2.5% |
| Standard Deviation (Sample) | 4.0% | 4.8% |
| Standard Deviation (Population) | 4.0% | 4.7% |
Similar Demographics by Divorced or Separated
Demographics Similar to Nicaraguans by Divorced or Separated
In terms of divorced or separated, the demographic groups most similar to Nicaraguans are Native/Alaskan (13.0%, a difference of 0.050%), Venezuelan (13.0%, a difference of 0.12%), Immigrants from Jamaica (13.0%, a difference of 0.16%), Celtic (13.0%, a difference of 0.41%), and Apache (12.9%, a difference of 0.54%).
| Demographics | Rating | Rank | Divorced or Separated |
| Iroquois | 0.0 /100 | #289 | Tragic 12.9% |
| Pima | 0.0 /100 | #290 | Tragic 12.9% |
| Immigrants | Honduras | 0.0 /100 | #291 | Tragic 12.9% |
| Scotch-Irish | 0.0 /100 | #292 | Tragic 12.9% |
| Jamaicans | 0.0 /100 | #293 | Tragic 12.9% |
| Apache | 0.0 /100 | #294 | Tragic 12.9% |
| Celtics | 0.0 /100 | #295 | Tragic 13.0% |
| Nicaraguans | 0.0 /100 | #296 | Tragic 13.0% |
| Natives/Alaskans | 0.0 /100 | #297 | Tragic 13.0% |
| Venezuelans | 0.0 /100 | #298 | Tragic 13.0% |
| Immigrants | Jamaica | 0.0 /100 | #299 | Tragic 13.0% |
| Immigrants | Cabo Verde | 0.0 /100 | #300 | Tragic 13.1% |
| Alaskan Athabascans | 0.0 /100 | #301 | Tragic 13.1% |
| Immigrants | Venezuela | 0.0 /100 | #302 | Tragic 13.1% |
| Cape Verdeans | 0.0 /100 | #303 | Tragic 13.1% |
Demographics Similar to Immigrants from Morocco by Divorced or Separated
In terms of divorced or separated, the demographic groups most similar to Immigrants from Morocco are Lebanese (11.9%, a difference of 0.030%), Australian (11.9%, a difference of 0.050%), Immigrants from Netherlands (11.9%, a difference of 0.060%), Alsatian (11.9%, a difference of 0.070%), and Immigrants from Zimbabwe (11.9%, a difference of 0.090%).
| Demographics | Rating | Rank | Divorced or Separated |
| Argentineans | 85.1 /100 | #134 | Excellent 11.9% |
| Danes | 84.8 /100 | #135 | Excellent 11.9% |
| Carpatho Rusyns | 84.8 /100 | #136 | Excellent 11.9% |
| Alsatians | 84.0 /100 | #137 | Excellent 11.9% |
| Immigrants | Netherlands | 83.9 /100 | #138 | Excellent 11.9% |
| Australians | 83.6 /100 | #139 | Excellent 11.9% |
| Lebanese | 83.4 /100 | #140 | Excellent 11.9% |
| Immigrants | Morocco | 82.9 /100 | #141 | Excellent 11.9% |
| Immigrants | Zimbabwe | 81.5 /100 | #142 | Excellent 11.9% |
| Pakistanis | 81.3 /100 | #143 | Excellent 11.9% |
| Peruvians | 80.9 /100 | #144 | Excellent 11.9% |
| Croatians | 80.6 /100 | #145 | Excellent 11.9% |
| Immigrants | Grenada | 79.1 /100 | #146 | Good 11.9% |
| Poles | 78.6 /100 | #147 | Good 11.9% |
| Italians | 77.8 /100 | #148 | Good 11.9% |