Filipino vs Sierra Leonean Single Father Households
COMPARE
Filipino
Sierra Leonean
Single Father Households
Single Father Households Comparison
Filipinos
Sierra Leoneans
1.8%
SINGLE FATHER HOUSEHOLDS
100.0/ 100
METRIC RATING
3rd/ 347
METRIC RANK
2.5%
SINGLE FATHER HOUSEHOLDS
5.9/ 100
METRIC RATING
237th/ 347
METRIC RANK
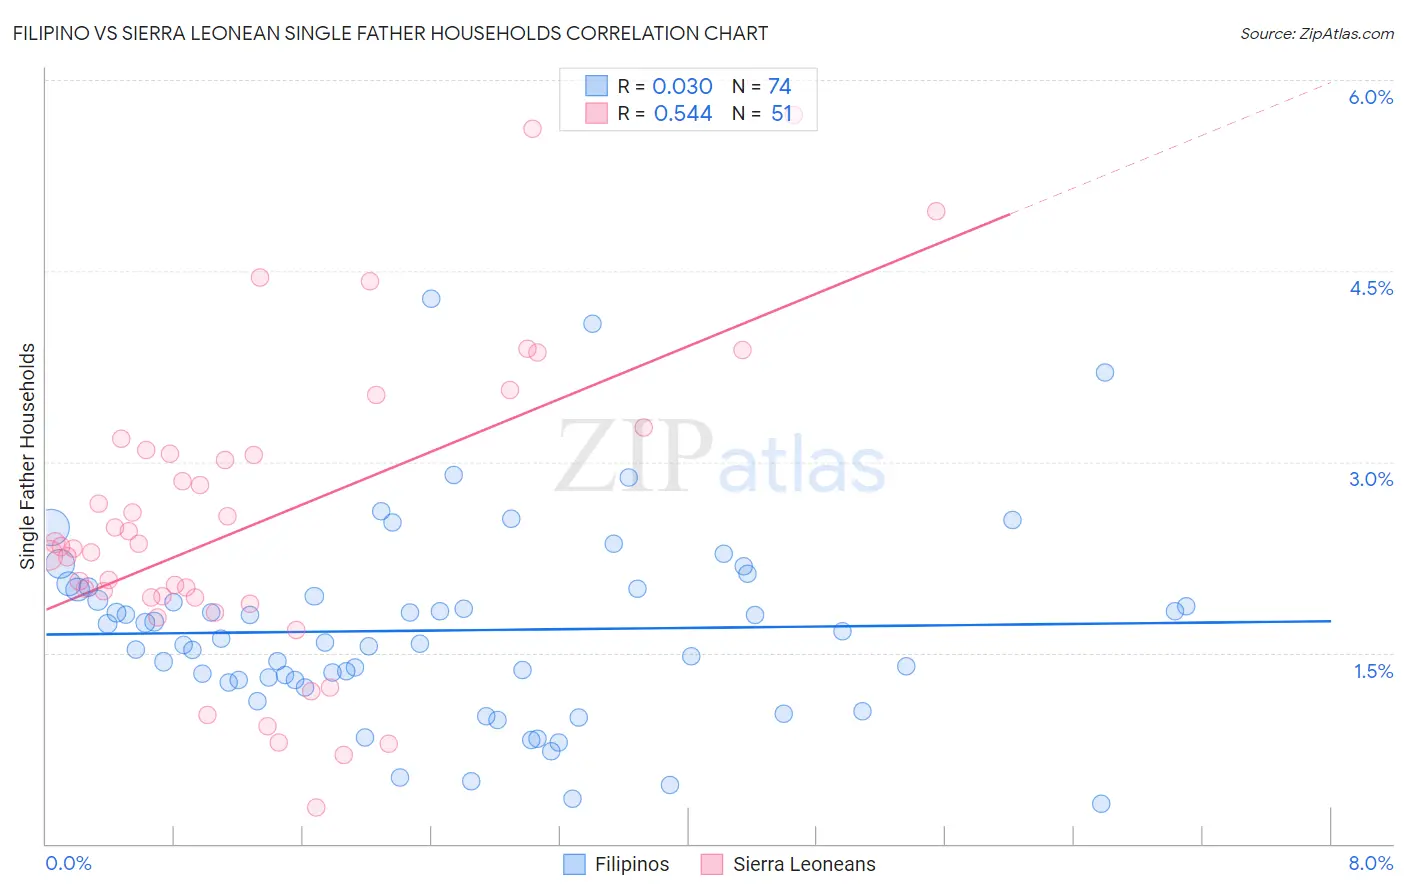
Filipino vs Sierra Leonean Single Father Households Correlation Chart
The statistical analysis conducted on geographies consisting of 252,994,105 people shows no correlation between the proportion of Filipinos and percentage of single father households in the United States with a correlation coefficient (R) of 0.030 and weighted average of 1.8%. Similarly, the statistical analysis conducted on geographies consisting of 83,228,063 people shows a substantial positive correlation between the proportion of Sierra Leoneans and percentage of single father households in the United States with a correlation coefficient (R) of 0.544 and weighted average of 2.5%, a difference of 36.2%.
Single Father Households Correlation Summary
| Measurement | Filipino | Sierra Leonean |
| Minimum | 0.31% | 0.29% |
| Maximum | 4.3% | 5.7% |
| Range | 4.0% | 5.4% |
| Mean | 1.7% | 2.5% |
| Median | 1.6% | 2.3% |
| Interquartile 25% (IQ1) | 1.3% | 1.9% |
| Interquartile 75% (IQ3) | 2.0% | 3.1% |
| Interquartile Range (IQR) | 0.72% | 1.2% |
| Standard Deviation (Sample) | 0.76% | 1.2% |
| Standard Deviation (Population) | 0.75% | 1.2% |
Similar Demographics by Single Father Households
Demographics Similar to Filipinos by Single Father Households
In terms of single father households, the demographic groups most similar to Filipinos are Immigrants from Israel (1.8%, a difference of 0.42%), Soviet Union (1.8%, a difference of 0.46%), Immigrants from Uzbekistan (1.8%, a difference of 0.66%), Immigrants from Hong Kong (1.8%, a difference of 1.6%), and Immigrants from Taiwan (1.8%, a difference of 2.0%).
| Demographics | Rating | Rank | Single Father Households |
| Soviet Union | 100.0 /100 | #1 | Exceptional 1.8% |
| Immigrants | Israel | 100.0 /100 | #2 | Exceptional 1.8% |
| Filipinos | 100.0 /100 | #3 | Exceptional 1.8% |
| Immigrants | Uzbekistan | 100.0 /100 | #4 | Exceptional 1.8% |
| Immigrants | Hong Kong | 100.0 /100 | #5 | Exceptional 1.8% |
| Immigrants | Taiwan | 100.0 /100 | #6 | Exceptional 1.8% |
| Cypriots | 100.0 /100 | #7 | Exceptional 1.8% |
| Immigrants | Ireland | 100.0 /100 | #8 | Exceptional 1.8% |
| Immigrants | China | 100.0 /100 | #9 | Exceptional 1.8% |
| Okinawans | 100.0 /100 | #10 | Exceptional 1.9% |
| Immigrants | Belarus | 100.0 /100 | #11 | Exceptional 1.9% |
| Immigrants | Greece | 100.0 /100 | #12 | Exceptional 1.9% |
| Immigrants | Singapore | 100.0 /100 | #13 | Exceptional 1.9% |
| Immigrants | Lithuania | 100.0 /100 | #14 | Exceptional 1.9% |
| Immigrants | Eastern Asia | 100.0 /100 | #15 | Exceptional 1.9% |
Demographics Similar to Sierra Leoneans by Single Father Households
In terms of single father households, the demographic groups most similar to Sierra Leoneans are Immigrants from Sierra Leone (2.5%, a difference of 0.030%), Immigrants from Oceania (2.5%, a difference of 0.040%), Cajun (2.5%, a difference of 0.050%), Immigrants (2.5%, a difference of 0.10%), and African (2.5%, a difference of 0.12%).
| Demographics | Rating | Rank | Single Father Households |
| Sub-Saharan Africans | 8.3 /100 | #230 | Tragic 2.4% |
| Immigrants | Nonimmigrants | 7.6 /100 | #231 | Tragic 2.4% |
| Pennsylvania Germans | 7.3 /100 | #232 | Tragic 2.4% |
| Immigrants | Western Africa | 7.0 /100 | #233 | Tragic 2.4% |
| Africans | 6.3 /100 | #234 | Tragic 2.5% |
| Immigrants | Immigrants | 6.3 /100 | #235 | Tragic 2.5% |
| Cajuns | 6.1 /100 | #236 | Tragic 2.5% |
| Sierra Leoneans | 5.9 /100 | #237 | Tragic 2.5% |
| Immigrants | Sierra Leone | 5.8 /100 | #238 | Tragic 2.5% |
| Immigrants | Oceania | 5.8 /100 | #239 | Tragic 2.5% |
| Immigrants | Dominica | 4.8 /100 | #240 | Tragic 2.5% |
| Portuguese | 4.1 /100 | #241 | Tragic 2.5% |
| Osage | 4.1 /100 | #242 | Tragic 2.5% |
| Spaniards | 3.1 /100 | #243 | Tragic 2.5% |
| Immigrants | Middle Africa | 2.8 /100 | #244 | Tragic 2.5% |