Fijian vs U.S. Virgin Islander Professional Degree
COMPARE
Fijian
U.S. Virgin Islander
Professional Degree
Professional Degree Comparison
Fijians
U.S. Virgin Islanders
2.9%
PROFESSIONAL DEGREE
0.0/ 100
METRIC RATING
336th/ 347
METRIC RANK
3.7%
PROFESSIONAL DEGREE
1.0/ 100
METRIC RATING
262nd/ 347
METRIC RANK
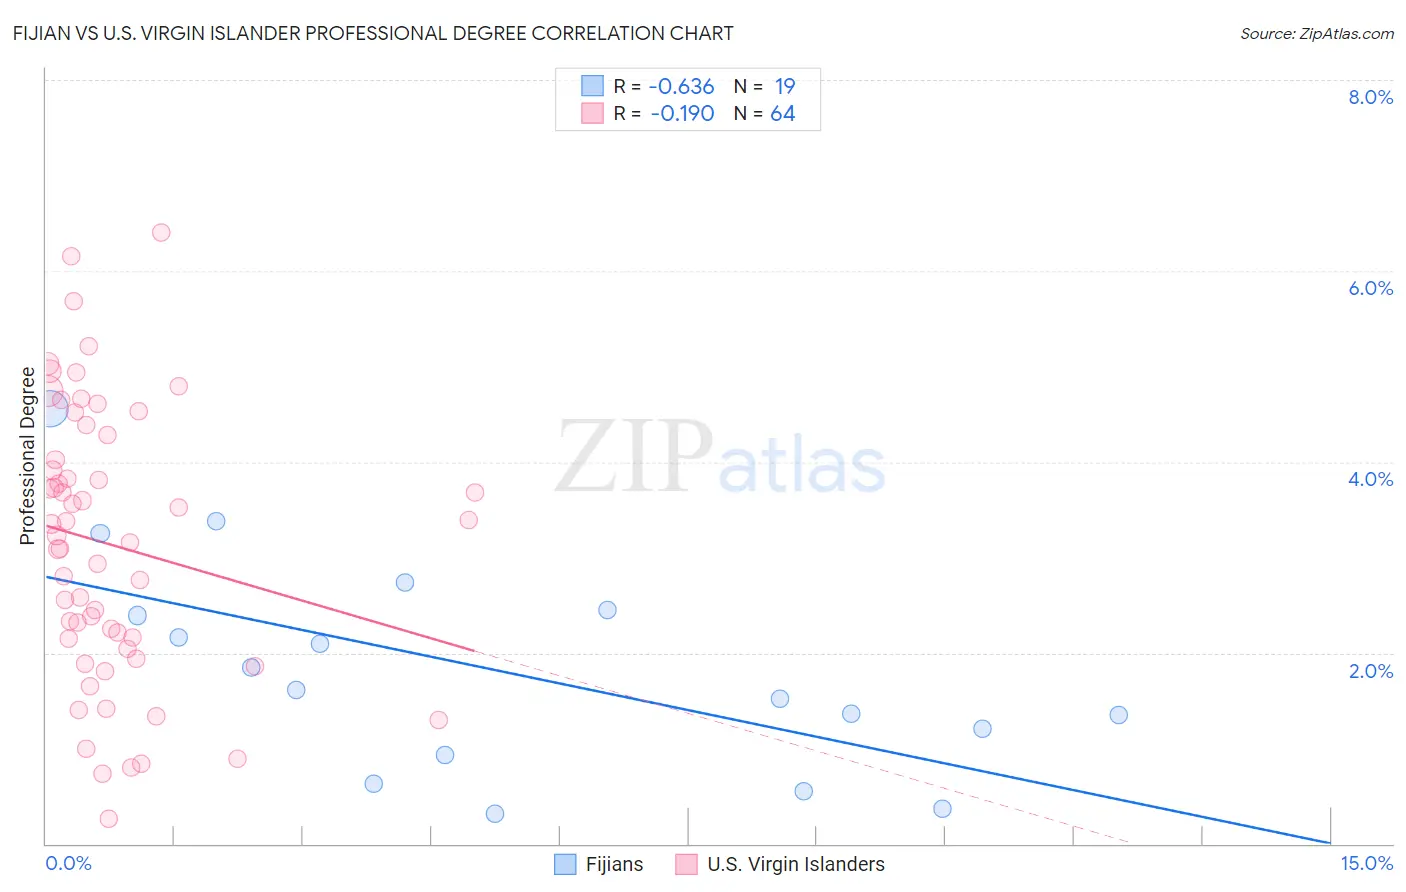
Fijian vs U.S. Virgin Islander Professional Degree Correlation Chart
The statistical analysis conducted on geographies consisting of 55,894,250 people shows a significant negative correlation between the proportion of Fijians and percentage of population with at least professional degree education in the United States with a correlation coefficient (R) of -0.636 and weighted average of 2.9%. Similarly, the statistical analysis conducted on geographies consisting of 87,432,219 people shows a poor negative correlation between the proportion of U.S. Virgin Islanders and percentage of population with at least professional degree education in the United States with a correlation coefficient (R) of -0.190 and weighted average of 3.7%, a difference of 25.2%.
Professional Degree Correlation Summary
| Measurement | Fijian | U.S. Virgin Islander |
| Minimum | 0.32% | 0.26% |
| Maximum | 4.6% | 6.4% |
| Range | 4.2% | 6.1% |
| Mean | 1.8% | 3.1% |
| Median | 1.6% | 3.2% |
| Interquartile 25% (IQ1) | 0.93% | 2.1% |
| Interquartile 75% (IQ3) | 2.4% | 4.1% |
| Interquartile Range (IQR) | 1.5% | 2.1% |
| Standard Deviation (Sample) | 1.1% | 1.4% |
| Standard Deviation (Population) | 1.1% | 1.4% |
Similar Demographics by Professional Degree
Demographics Similar to Fijians by Professional Degree
In terms of professional degree, the demographic groups most similar to Fijians are Native/Alaskan (3.0%, a difference of 1.0%), Pennsylvania German (3.0%, a difference of 1.6%), Arapaho (2.9%, a difference of 1.8%), Navajo (2.9%, a difference of 1.9%), and Immigrants from Central America (2.9%, a difference of 2.0%).
| Demographics | Rating | Rank | Professional Degree |
| Bangladeshis | 0.0 /100 | #329 | Tragic 3.1% |
| Immigrants | Cabo Verde | 0.0 /100 | #330 | Tragic 3.1% |
| Kiowa | 0.0 /100 | #331 | Tragic 3.1% |
| Yakama | 0.0 /100 | #332 | Tragic 3.1% |
| Puget Sound Salish | 0.0 /100 | #333 | Tragic 3.1% |
| Pennsylvania Germans | 0.0 /100 | #334 | Tragic 3.0% |
| Natives/Alaskans | 0.0 /100 | #335 | Tragic 3.0% |
| Fijians | 0.0 /100 | #336 | Tragic 2.9% |
| Arapaho | 0.0 /100 | #337 | Tragic 2.9% |
| Navajo | 0.0 /100 | #338 | Tragic 2.9% |
| Immigrants | Central America | 0.0 /100 | #339 | Tragic 2.9% |
| Yup'ik | 0.0 /100 | #340 | Tragic 2.9% |
| Tohono O'odham | 0.0 /100 | #341 | Tragic 2.8% |
| Immigrants | Azores | 0.0 /100 | #342 | Tragic 2.8% |
| Mexicans | 0.0 /100 | #343 | Tragic 2.7% |
Demographics Similar to U.S. Virgin Islanders by Professional Degree
In terms of professional degree, the demographic groups most similar to U.S. Virgin Islanders are Immigrants from Guyana (3.7%, a difference of 0.010%), Indonesian (3.7%, a difference of 0.19%), African (3.7%, a difference of 0.20%), Immigrants from St. Vincent and the Grenadines (3.7%, a difference of 0.42%), and Bahamian (3.7%, a difference of 0.50%).
| Demographics | Rating | Rank | Professional Degree |
| Osage | 1.2 /100 | #255 | Tragic 3.7% |
| Iroquois | 1.2 /100 | #256 | Tragic 3.7% |
| Bahamians | 1.1 /100 | #257 | Tragic 3.7% |
| Immigrants | St. Vincent and the Grenadines | 1.1 /100 | #258 | Tragic 3.7% |
| Africans | 1.0 /100 | #259 | Tragic 3.7% |
| Indonesians | 1.0 /100 | #260 | Tragic 3.7% |
| Immigrants | Guyana | 1.0 /100 | #261 | Tragic 3.7% |
| U.S. Virgin Islanders | 1.0 /100 | #262 | Tragic 3.7% |
| Hopi | 0.9 /100 | #263 | Tragic 3.6% |
| Immigrants | Cambodia | 0.9 /100 | #264 | Tragic 3.6% |
| Immigrants | Congo | 0.8 /100 | #265 | Tragic 3.6% |
| Central American Indians | 0.8 /100 | #266 | Tragic 3.6% |
| Delaware | 0.7 /100 | #267 | Tragic 3.6% |
| Aleuts | 0.7 /100 | #268 | Tragic 3.6% |
| Immigrants | Cuba | 0.6 /100 | #269 | Tragic 3.6% |