Fijian vs Immigrants from Poland Currently Married
COMPARE
Fijian
Immigrants from Poland
Currently Married
Currently Married Comparison
Fijians
Immigrants from Poland
46.3%
CURRENTLY MARRIED
30.3/ 100
METRIC RATING
189th/ 347
METRIC RANK
48.1%
CURRENTLY MARRIED
96.9/ 100
METRIC RATING
80th/ 347
METRIC RANK
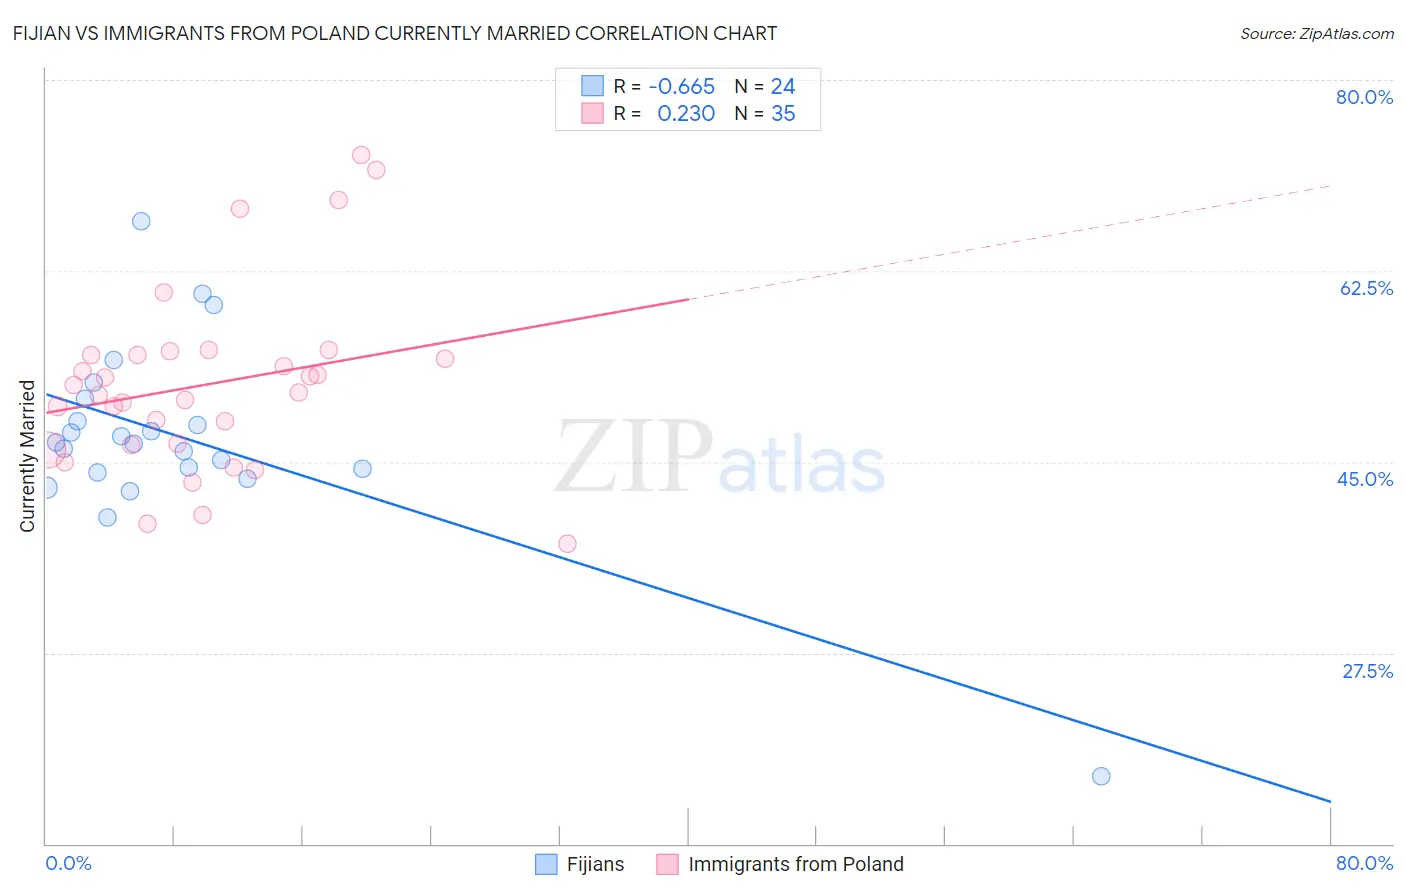
Fijian vs Immigrants from Poland Currently Married Correlation Chart
The statistical analysis conducted on geographies consisting of 55,948,768 people shows a significant negative correlation between the proportion of Fijians and percentage of population currently married in the United States with a correlation coefficient (R) of -0.665 and weighted average of 46.3%. Similarly, the statistical analysis conducted on geographies consisting of 304,845,419 people shows a weak positive correlation between the proportion of Immigrants from Poland and percentage of population currently married in the United States with a correlation coefficient (R) of 0.230 and weighted average of 48.1%, a difference of 3.9%.
Currently Married Correlation Summary
| Measurement | Fijian | Immigrants from Poland |
| Minimum | 16.2% | 37.5% |
| Maximum | 67.1% | 73.1% |
| Range | 50.9% | 35.6% |
| Mean | 47.2% | 52.1% |
| Median | 46.8% | 51.3% |
| Interquartile 25% (IQ1) | 44.2% | 46.5% |
| Interquartile 75% (IQ3) | 49.8% | 54.8% |
| Interquartile Range (IQR) | 5.5% | 8.3% |
| Standard Deviation (Sample) | 9.1% | 8.4% |
| Standard Deviation (Population) | 8.9% | 8.3% |
Similar Demographics by Currently Married
Demographics Similar to Fijians by Currently Married
In terms of currently married, the demographic groups most similar to Fijians are Choctaw (46.3%, a difference of 0.050%), Colombian (46.3%, a difference of 0.060%), Immigrants from France (46.2%, a difference of 0.12%), Immigrants from Peru (46.4%, a difference of 0.21%), and Soviet Union (46.2%, a difference of 0.21%).
| Demographics | Rating | Rank | Currently Married |
| Potawatomi | 41.9 /100 | #182 | Average 46.5% |
| Immigrants | Northern Africa | 39.7 /100 | #183 | Fair 46.5% |
| Brazilians | 39.3 /100 | #184 | Fair 46.4% |
| Mongolians | 37.6 /100 | #185 | Fair 46.4% |
| Immigrants | Chile | 36.8 /100 | #186 | Fair 46.4% |
| Immigrants | Peru | 35.3 /100 | #187 | Fair 46.4% |
| Colombians | 31.8 /100 | #188 | Fair 46.3% |
| Fijians | 30.3 /100 | #189 | Fair 46.3% |
| Choctaw | 29.1 /100 | #190 | Fair 46.3% |
| Immigrants | France | 27.7 /100 | #191 | Fair 46.2% |
| Soviet Union | 25.7 /100 | #192 | Fair 46.2% |
| Immigrants | Fiji | 25.0 /100 | #193 | Fair 46.2% |
| South Americans | 23.8 /100 | #194 | Fair 46.1% |
| Immigrants | Nepal | 23.7 /100 | #195 | Fair 46.1% |
| Immigrants | Bosnia and Herzegovina | 22.2 /100 | #196 | Fair 46.1% |
Demographics Similar to Immigrants from Poland by Currently Married
In terms of currently married, the demographic groups most similar to Immigrants from Poland are Immigrants from Sri Lanka (48.1%, a difference of 0.010%), Immigrants from Europe (48.1%, a difference of 0.010%), Bolivian (48.1%, a difference of 0.010%), Immigrants from Israel (48.1%, a difference of 0.020%), and Immigrants from South Africa (48.1%, a difference of 0.030%).
| Demographics | Rating | Rank | Currently Married |
| Immigrants | Eastern Asia | 97.5 /100 | #73 | Exceptional 48.2% |
| Estonians | 97.4 /100 | #74 | Exceptional 48.2% |
| Immigrants | Belarus | 97.2 /100 | #75 | Exceptional 48.1% |
| Basques | 97.2 /100 | #76 | Exceptional 48.1% |
| Slovenes | 97.1 /100 | #77 | Exceptional 48.1% |
| Immigrants | Belgium | 97.1 /100 | #78 | Exceptional 48.1% |
| Immigrants | South Africa | 97.0 /100 | #79 | Exceptional 48.1% |
| Immigrants | Poland | 96.9 /100 | #80 | Exceptional 48.1% |
| Immigrants | Sri Lanka | 96.9 /100 | #81 | Exceptional 48.1% |
| Immigrants | Europe | 96.9 /100 | #82 | Exceptional 48.1% |
| Bolivians | 96.9 /100 | #83 | Exceptional 48.1% |
| Immigrants | Israel | 96.9 /100 | #84 | Exceptional 48.1% |
| French Canadians | 96.3 /100 | #85 | Exceptional 48.0% |
| Immigrants | Japan | 96.2 /100 | #86 | Exceptional 48.0% |
| Jordanians | 96.2 /100 | #87 | Exceptional 48.0% |