Ethiopian vs Trinidadian and Tobagonian 5th Grade
COMPARE
Ethiopian
Trinidadian and Tobagonian
5th Grade
5th Grade Comparison
Ethiopians
Trinidadians and Tobagonians
96.9%
5TH GRADE
1.2/ 100
METRIC RATING
246th/ 347
METRIC RANK
96.7%
5TH GRADE
0.1/ 100
METRIC RATING
272nd/ 347
METRIC RANK
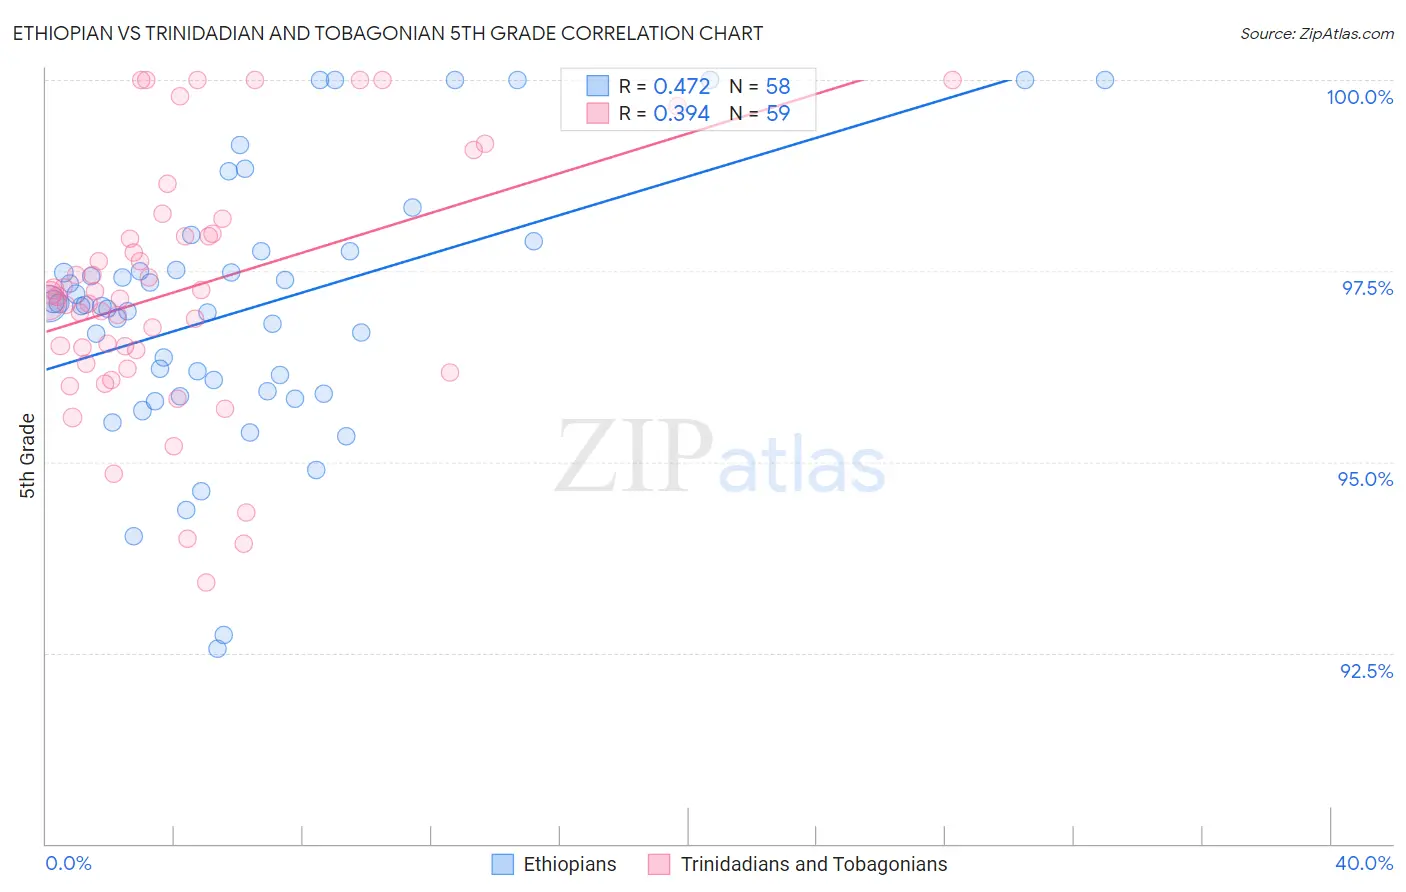
Ethiopian vs Trinidadian and Tobagonian 5th Grade Correlation Chart
The statistical analysis conducted on geographies consisting of 223,120,541 people shows a moderate positive correlation between the proportion of Ethiopians and percentage of population with at least 5th grade education in the United States with a correlation coefficient (R) of 0.472 and weighted average of 96.9%. Similarly, the statistical analysis conducted on geographies consisting of 219,882,819 people shows a mild positive correlation between the proportion of Trinidadians and Tobagonians and percentage of population with at least 5th grade education in the United States with a correlation coefficient (R) of 0.394 and weighted average of 96.7%, a difference of 0.23%.
5th Grade Correlation Summary
| Measurement | Ethiopian | Trinidadian and Tobagonian |
| Minimum | 92.6% | 93.4% |
| Maximum | 100.0% | 100.0% |
| Range | 7.4% | 6.6% |
| Mean | 97.0% | 97.3% |
| Median | 97.1% | 97.2% |
| Interquartile 25% (IQ1) | 95.9% | 96.3% |
| Interquartile 75% (IQ3) | 97.8% | 98.0% |
| Interquartile Range (IQR) | 1.8% | 1.7% |
| Standard Deviation (Sample) | 1.7% | 1.6% |
| Standard Deviation (Population) | 1.7% | 1.6% |
Similar Demographics by 5th Grade
Demographics Similar to Ethiopians by 5th Grade
In terms of 5th grade, the demographic groups most similar to Ethiopians are Colombian (96.9%, a difference of 0.010%), Immigrants from Africa (96.9%, a difference of 0.010%), U.S. Virgin Islander (96.9%, a difference of 0.010%), Immigrants from Uruguay (96.9%, a difference of 0.020%), and Immigrants from Liberia (96.9%, a difference of 0.020%).
| Demographics | Rating | Rank | 5th Grade |
| Nigerians | 1.9 /100 | #239 | Tragic 96.9% |
| Indians (Asian) | 1.9 /100 | #240 | Tragic 96.9% |
| Immigrants | Asia | 1.7 /100 | #241 | Tragic 96.9% |
| Immigrants | Costa Rica | 1.6 /100 | #242 | Tragic 96.9% |
| Immigrants | Eastern Africa | 1.6 /100 | #243 | Tragic 96.9% |
| Koreans | 1.6 /100 | #244 | Tragic 96.9% |
| Colombians | 1.3 /100 | #245 | Tragic 96.9% |
| Ethiopians | 1.2 /100 | #246 | Tragic 96.9% |
| Immigrants | Africa | 1.1 /100 | #247 | Tragic 96.9% |
| U.S. Virgin Islanders | 1.1 /100 | #248 | Tragic 96.9% |
| Immigrants | Uruguay | 1.0 /100 | #249 | Tragic 96.9% |
| Immigrants | Liberia | 1.0 /100 | #250 | Tragic 96.9% |
| Bolivians | 0.9 /100 | #251 | Tragic 96.9% |
| Jamaicans | 0.9 /100 | #252 | Tragic 96.9% |
| Immigrants | Middle Africa | 0.8 /100 | #253 | Tragic 96.8% |
Demographics Similar to Trinidadians and Tobagonians by 5th Grade
In terms of 5th grade, the demographic groups most similar to Trinidadians and Tobagonians are Immigrants from Hong Kong (96.7%, a difference of 0.010%), Yaqui (96.7%, a difference of 0.010%), Immigrants from Cameroon (96.7%, a difference of 0.010%), Afghan (96.7%, a difference of 0.020%), and Immigrants from Peru (96.6%, a difference of 0.020%).
| Demographics | Rating | Rank | 5th Grade |
| Taiwanese | 0.3 /100 | #265 | Tragic 96.7% |
| Immigrants | Nigeria | 0.3 /100 | #266 | Tragic 96.7% |
| Immigrants | South America | 0.3 /100 | #267 | Tragic 96.7% |
| Armenians | 0.3 /100 | #268 | Tragic 96.7% |
| Ghanaians | 0.2 /100 | #269 | Tragic 96.7% |
| Afghans | 0.2 /100 | #270 | Tragic 96.7% |
| Immigrants | Hong Kong | 0.2 /100 | #271 | Tragic 96.7% |
| Trinidadians and Tobagonians | 0.1 /100 | #272 | Tragic 96.7% |
| Yaqui | 0.1 /100 | #273 | Tragic 96.7% |
| Immigrants | Cameroon | 0.1 /100 | #274 | Tragic 96.7% |
| Immigrants | Peru | 0.1 /100 | #275 | Tragic 96.6% |
| Cubans | 0.1 /100 | #276 | Tragic 96.6% |
| Immigrants | Bolivia | 0.1 /100 | #277 | Tragic 96.6% |
| Immigrants | Ghana | 0.1 /100 | #278 | Tragic 96.6% |
| Immigrants | Philippines | 0.1 /100 | #279 | Tragic 96.6% |