Ethiopian vs Trinidadian and Tobagonian Disability Age 65 to 74
COMPARE
Ethiopian
Trinidadian and Tobagonian
Disability Age 65 to 74
Disability Age 65 to 74 Comparison
Ethiopians
Trinidadians and Tobagonians
22.7%
DISABILITY AGE 65 TO 74
87.9/ 100
METRIC RATING
136th/ 347
METRIC RANK
23.9%
DISABILITY AGE 65 TO 74
16.4/ 100
METRIC RATING
210th/ 347
METRIC RANK
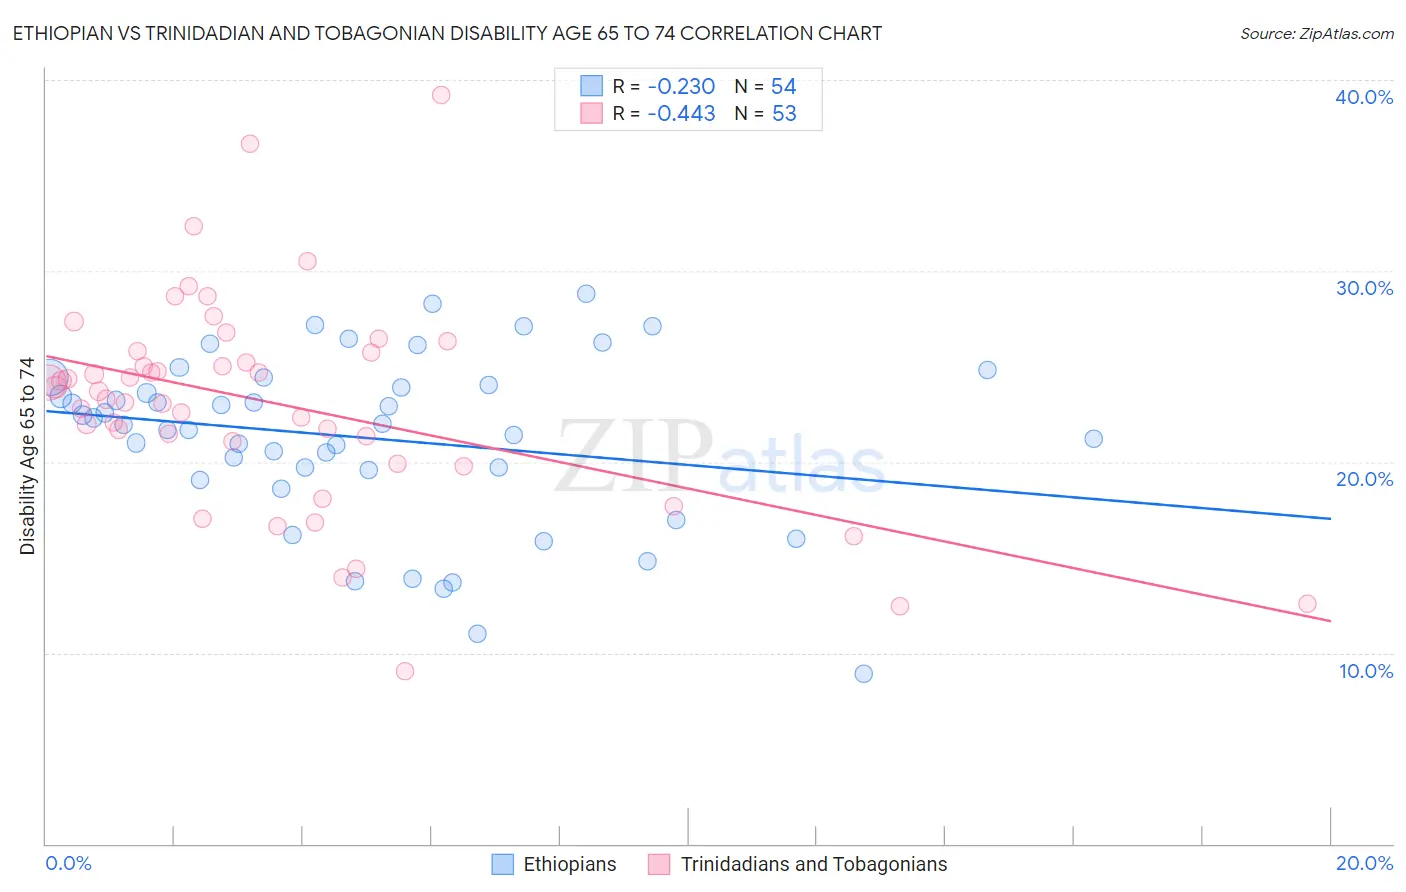
Ethiopian vs Trinidadian and Tobagonian Disability Age 65 to 74 Correlation Chart
The statistical analysis conducted on geographies consisting of 222,880,036 people shows a weak negative correlation between the proportion of Ethiopians and percentage of population with a disability between the ages 65 and 75 in the United States with a correlation coefficient (R) of -0.230 and weighted average of 22.7%. Similarly, the statistical analysis conducted on geographies consisting of 219,459,404 people shows a moderate negative correlation between the proportion of Trinidadians and Tobagonians and percentage of population with a disability between the ages 65 and 75 in the United States with a correlation coefficient (R) of -0.443 and weighted average of 23.9%, a difference of 5.4%.
Disability Age 65 to 74 Correlation Summary
| Measurement | Ethiopian | Trinidadian and Tobagonian |
| Minimum | 8.9% | 9.0% |
| Maximum | 28.8% | 39.2% |
| Range | 19.9% | 30.2% |
| Mean | 21.3% | 23.1% |
| Median | 22.0% | 23.7% |
| Interquartile 25% (IQ1) | 19.6% | 20.5% |
| Interquartile 75% (IQ3) | 24.0% | 25.8% |
| Interquartile Range (IQR) | 4.4% | 5.3% |
| Standard Deviation (Sample) | 4.5% | 5.6% |
| Standard Deviation (Population) | 4.4% | 5.6% |
Similar Demographics by Disability Age 65 to 74
Demographics Similar to Ethiopians by Disability Age 65 to 74
In terms of disability age 65 to 74, the demographic groups most similar to Ethiopians are Taiwanese (22.7%, a difference of 0.030%), Immigrants from Ukraine (22.6%, a difference of 0.070%), Immigrants from Moldova (22.7%, a difference of 0.090%), Afghan (22.6%, a difference of 0.10%), and Northern European (22.6%, a difference of 0.15%).
| Demographics | Rating | Rank | Disability Age 65 to 74 |
| Immigrants | Uruguay | 90.1 /100 | #129 | Exceptional 22.6% |
| Immigrants | Albania | 90.0 /100 | #130 | Excellent 22.6% |
| Immigrants | Nepal | 89.4 /100 | #131 | Excellent 22.6% |
| Costa Ricans | 89.2 /100 | #132 | Excellent 22.6% |
| Northern Europeans | 88.9 /100 | #133 | Excellent 22.6% |
| Afghans | 88.6 /100 | #134 | Excellent 22.6% |
| Immigrants | Ukraine | 88.4 /100 | #135 | Excellent 22.6% |
| Ethiopians | 87.9 /100 | #136 | Excellent 22.7% |
| Taiwanese | 87.6 /100 | #137 | Excellent 22.7% |
| Immigrants | Moldova | 87.3 /100 | #138 | Excellent 22.7% |
| Immigrants | Syria | 85.8 /100 | #139 | Excellent 22.7% |
| Ugandans | 85.4 /100 | #140 | Excellent 22.7% |
| Belgians | 85.3 /100 | #141 | Excellent 22.7% |
| Immigrants | Ethiopia | 85.3 /100 | #142 | Excellent 22.7% |
| Arabs | 84.8 /100 | #143 | Excellent 22.8% |
Demographics Similar to Trinidadians and Tobagonians by Disability Age 65 to 74
In terms of disability age 65 to 74, the demographic groups most similar to Trinidadians and Tobagonians are Immigrants from West Indies (23.9%, a difference of 0.050%), French (23.9%, a difference of 0.070%), Nicaraguan (23.9%, a difference of 0.23%), Immigrants from Barbados (23.8%, a difference of 0.31%), and Immigrants from Kenya (23.8%, a difference of 0.31%).
| Demographics | Rating | Rank | Disability Age 65 to 74 |
| Kenyans | 23.2 /100 | #203 | Fair 23.7% |
| Immigrants | Grenada | 22.1 /100 | #204 | Fair 23.8% |
| Tongans | 20.8 /100 | #205 | Fair 23.8% |
| Immigrants | Jamaica | 20.7 /100 | #206 | Fair 23.8% |
| Immigrants | Sudan | 20.1 /100 | #207 | Fair 23.8% |
| Immigrants | Barbados | 19.6 /100 | #208 | Poor 23.8% |
| Immigrants | Kenya | 19.6 /100 | #209 | Poor 23.8% |
| Trinidadians and Tobagonians | 16.4 /100 | #210 | Poor 23.9% |
| Immigrants | West Indies | 15.9 /100 | #211 | Poor 23.9% |
| French | 15.7 /100 | #212 | Poor 23.9% |
| Nicaraguans | 14.3 /100 | #213 | Poor 23.9% |
| Immigrants | Oceania | 13.6 /100 | #214 | Poor 24.0% |
| Pennsylvania Germans | 13.3 /100 | #215 | Poor 24.0% |
| Jamaicans | 12.2 /100 | #216 | Poor 24.0% |
| Immigrants | Portugal | 11.7 /100 | #217 | Poor 24.0% |