Ethiopian vs Immigrants from Dominica 5th Grade
COMPARE
Ethiopian
Immigrants from Dominica
5th Grade
5th Grade Comparison
Ethiopians
Immigrants from Dominica
96.9%
5TH GRADE
1.2/ 100
METRIC RATING
246th/ 347
METRIC RANK
96.2%
5TH GRADE
0.0/ 100
METRIC RATING
298th/ 347
METRIC RANK
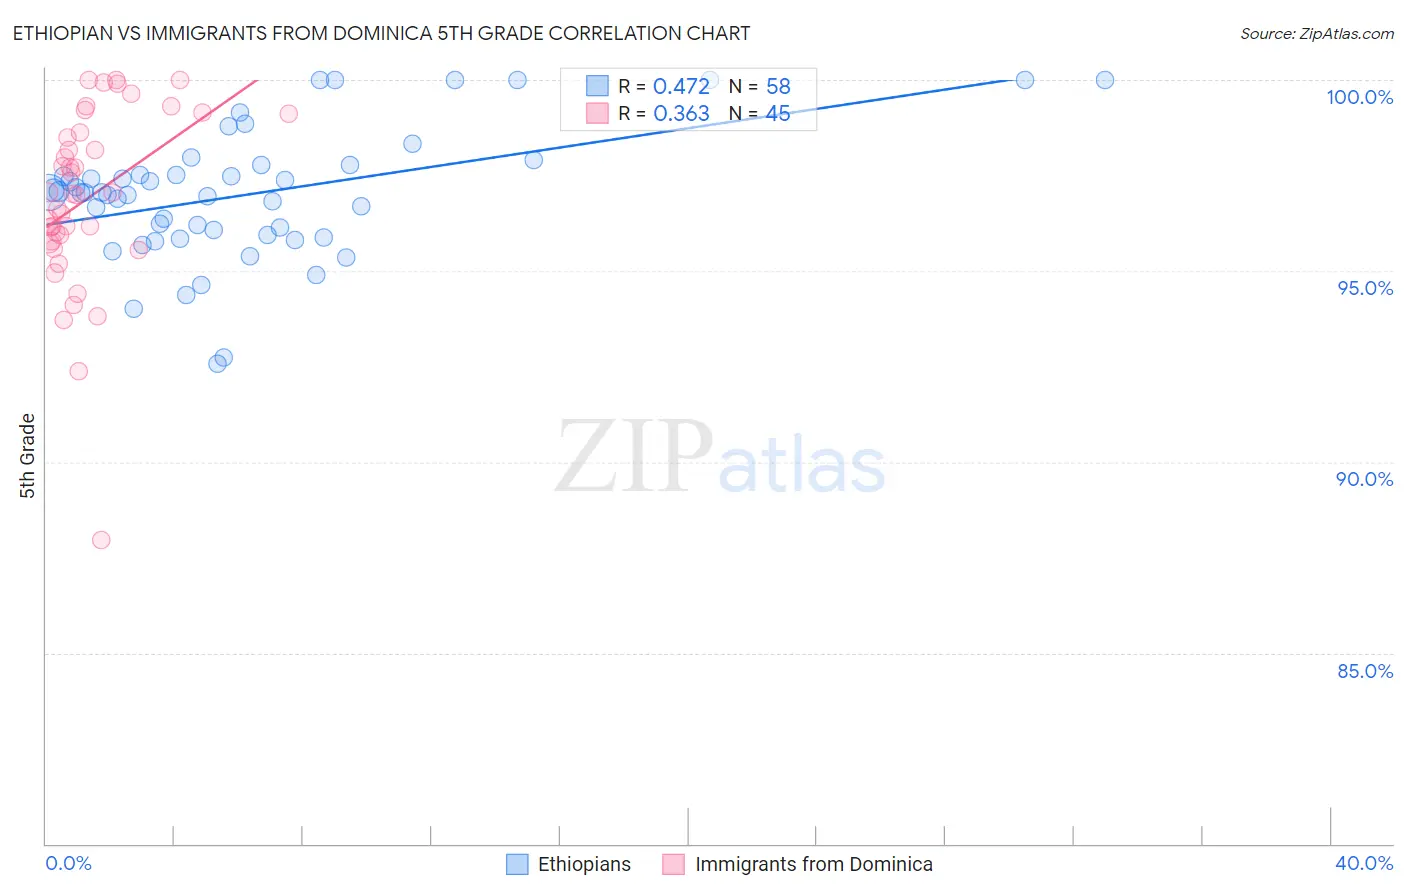
Ethiopian vs Immigrants from Dominica 5th Grade Correlation Chart
The statistical analysis conducted on geographies consisting of 223,120,541 people shows a moderate positive correlation between the proportion of Ethiopians and percentage of population with at least 5th grade education in the United States with a correlation coefficient (R) of 0.472 and weighted average of 96.9%. Similarly, the statistical analysis conducted on geographies consisting of 83,794,115 people shows a mild positive correlation between the proportion of Immigrants from Dominica and percentage of population with at least 5th grade education in the United States with a correlation coefficient (R) of 0.363 and weighted average of 96.2%, a difference of 0.71%.
5th Grade Correlation Summary
| Measurement | Ethiopian | Immigrants from Dominica |
| Minimum | 92.6% | 88.0% |
| Maximum | 100.0% | 100.0% |
| Range | 7.4% | 12.0% |
| Mean | 97.0% | 96.9% |
| Median | 97.1% | 97.0% |
| Interquartile 25% (IQ1) | 95.9% | 95.8% |
| Interquartile 75% (IQ3) | 97.8% | 98.9% |
| Interquartile Range (IQR) | 1.8% | 3.1% |
| Standard Deviation (Sample) | 1.7% | 2.4% |
| Standard Deviation (Population) | 1.7% | 2.3% |
Similar Demographics by 5th Grade
Demographics Similar to Ethiopians by 5th Grade
In terms of 5th grade, the demographic groups most similar to Ethiopians are Colombian (96.9%, a difference of 0.010%), Immigrants from Africa (96.9%, a difference of 0.010%), U.S. Virgin Islander (96.9%, a difference of 0.010%), Immigrants from Uruguay (96.9%, a difference of 0.020%), and Immigrants from Liberia (96.9%, a difference of 0.020%).
| Demographics | Rating | Rank | 5th Grade |
| Nigerians | 1.9 /100 | #239 | Tragic 96.9% |
| Indians (Asian) | 1.9 /100 | #240 | Tragic 96.9% |
| Immigrants | Asia | 1.7 /100 | #241 | Tragic 96.9% |
| Immigrants | Costa Rica | 1.6 /100 | #242 | Tragic 96.9% |
| Immigrants | Eastern Africa | 1.6 /100 | #243 | Tragic 96.9% |
| Koreans | 1.6 /100 | #244 | Tragic 96.9% |
| Colombians | 1.3 /100 | #245 | Tragic 96.9% |
| Ethiopians | 1.2 /100 | #246 | Tragic 96.9% |
| Immigrants | Africa | 1.1 /100 | #247 | Tragic 96.9% |
| U.S. Virgin Islanders | 1.1 /100 | #248 | Tragic 96.9% |
| Immigrants | Uruguay | 1.0 /100 | #249 | Tragic 96.9% |
| Immigrants | Liberia | 1.0 /100 | #250 | Tragic 96.9% |
| Bolivians | 0.9 /100 | #251 | Tragic 96.9% |
| Jamaicans | 0.9 /100 | #252 | Tragic 96.9% |
| Immigrants | Middle Africa | 0.8 /100 | #253 | Tragic 96.8% |
Demographics Similar to Immigrants from Dominica by 5th Grade
In terms of 5th grade, the demographic groups most similar to Immigrants from Dominica are Immigrants (96.2%, a difference of 0.030%), Haitian (96.3%, a difference of 0.050%), Immigrants from South Eastern Asia (96.3%, a difference of 0.080%), Sri Lankan (96.1%, a difference of 0.080%), and Immigrants from Cuba (96.1%, a difference of 0.10%).
| Demographics | Rating | Rank | 5th Grade |
| Malaysians | 0.0 /100 | #291 | Tragic 96.5% |
| Somalis | 0.0 /100 | #292 | Tragic 96.5% |
| Immigrants | Grenada | 0.0 /100 | #293 | Tragic 96.5% |
| Immigrants | Eritrea | 0.0 /100 | #294 | Tragic 96.4% |
| Immigrants | Somalia | 0.0 /100 | #295 | Tragic 96.4% |
| Immigrants | South Eastern Asia | 0.0 /100 | #296 | Tragic 96.3% |
| Haitians | 0.0 /100 | #297 | Tragic 96.3% |
| Immigrants | Dominica | 0.0 /100 | #298 | Tragic 96.2% |
| Immigrants | Immigrants | 0.0 /100 | #299 | Tragic 96.2% |
| Sri Lankans | 0.0 /100 | #300 | Tragic 96.1% |
| Immigrants | Cuba | 0.0 /100 | #301 | Tragic 96.1% |
| Guyanese | 0.0 /100 | #302 | Tragic 96.1% |
| Puerto Ricans | 0.0 /100 | #303 | Tragic 96.1% |
| Immigrants | Burma/Myanmar | 0.0 /100 | #304 | Tragic 96.1% |
| Immigrants | Laos | 0.0 /100 | #305 | Tragic 96.0% |