Estonian vs Immigrants from Saudi Arabia Female Poverty Among 18-24 Year Olds
COMPARE
Estonian
Immigrants from Saudi Arabia
Female Poverty Among 18-24 Year Olds
Female Poverty Among 18-24 Year Olds Comparison
Estonians
Immigrants from Saudi Arabia
20.7%
FEMALE POVERTY AMONG 18-24 YEAR OLDS
7.2/ 100
METRIC RATING
226th/ 347
METRIC RANK
25.3%
FEMALE POVERTY AMONG 18-24 YEAR OLDS
0.0/ 100
METRIC RATING
325th/ 347
METRIC RANK
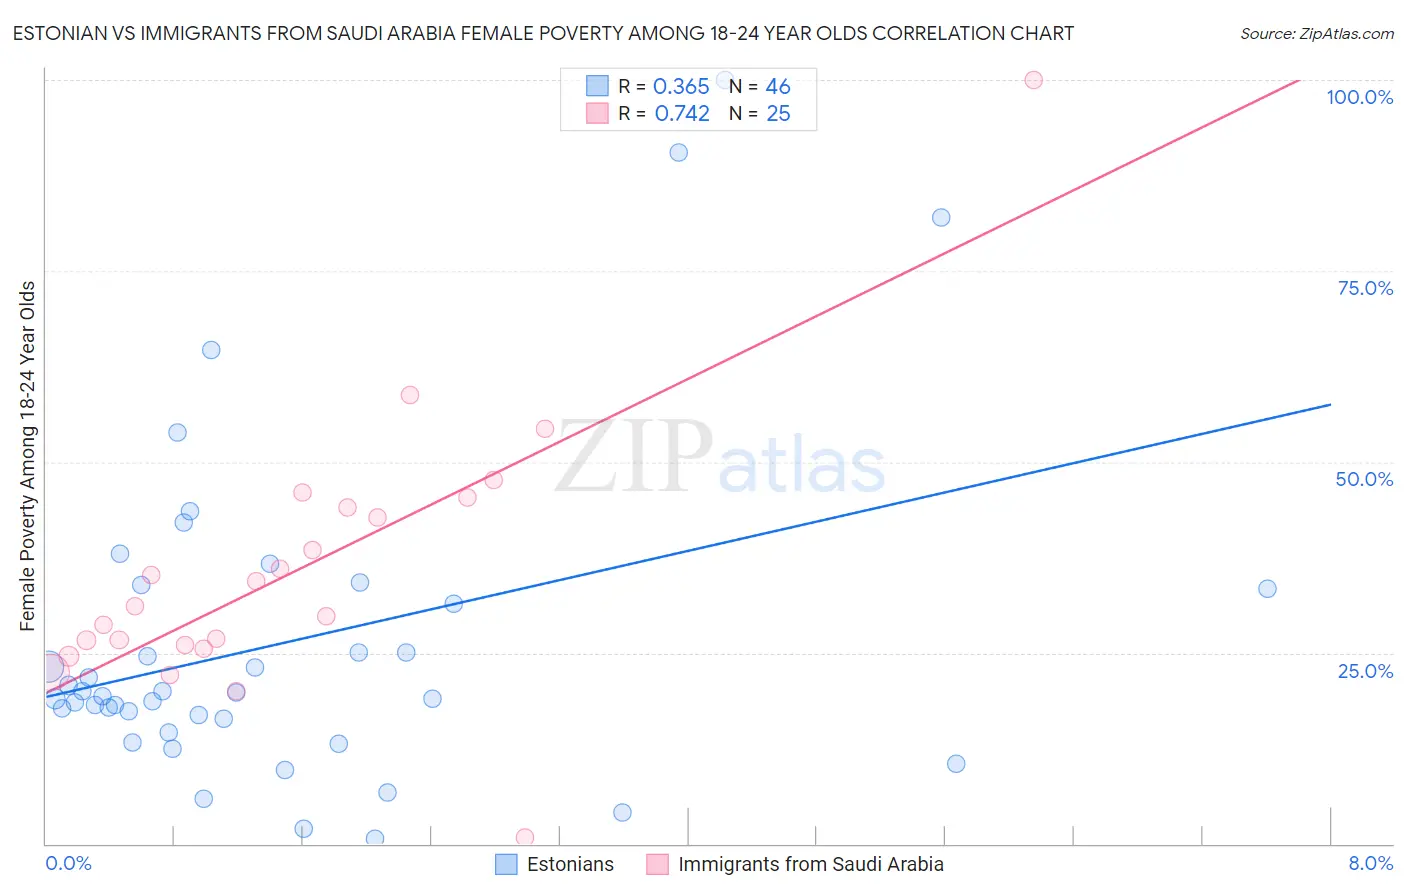
Estonian vs Immigrants from Saudi Arabia Female Poverty Among 18-24 Year Olds Correlation Chart
The statistical analysis conducted on geographies consisting of 122,061,434 people shows a mild positive correlation between the proportion of Estonians and poverty level among females between the ages 18 and 24 in the United States with a correlation coefficient (R) of 0.365 and weighted average of 20.7%. Similarly, the statistical analysis conducted on geographies consisting of 163,276,654 people shows a strong positive correlation between the proportion of Immigrants from Saudi Arabia and poverty level among females between the ages 18 and 24 in the United States with a correlation coefficient (R) of 0.742 and weighted average of 25.3%, a difference of 22.0%.
Female Poverty Among 18-24 Year Olds Correlation Summary
| Measurement | Estonian | Immigrants from Saudi Arabia |
| Minimum | 0.60% | 0.84% |
| Maximum | 100.0% | 100.0% |
| Range | 99.4% | 99.2% |
| Mean | 26.4% | 35.8% |
| Median | 19.5% | 31.1% |
| Interquartile 25% (IQ1) | 16.4% | 25.7% |
| Interquartile 75% (IQ3) | 33.3% | 44.7% |
| Interquartile Range (IQR) | 17.0% | 19.0% |
| Standard Deviation (Sample) | 21.4% | 18.2% |
| Standard Deviation (Population) | 21.2% | 17.9% |
Similar Demographics by Female Poverty Among 18-24 Year Olds
Demographics Similar to Estonians by Female Poverty Among 18-24 Year Olds
In terms of female poverty among 18-24 year olds, the demographic groups most similar to Estonians are Norwegian (20.7%, a difference of 0.020%), Immigrants from Sweden (20.7%, a difference of 0.070%), Immigrants from Liberia (20.7%, a difference of 0.080%), French (20.7%, a difference of 0.13%), and Ghanaian (20.8%, a difference of 0.13%).
| Demographics | Rating | Rank | Female Poverty Among 18-24 Year Olds |
| Immigrants | Micronesia | 9.6 /100 | #219 | Tragic 20.7% |
| British | 9.4 /100 | #220 | Tragic 20.7% |
| Barbadians | 9.0 /100 | #221 | Tragic 20.7% |
| Guatemalans | 8.1 /100 | #222 | Tragic 20.7% |
| French | 7.9 /100 | #223 | Tragic 20.7% |
| Immigrants | Liberia | 7.6 /100 | #224 | Tragic 20.7% |
| Norwegians | 7.3 /100 | #225 | Tragic 20.7% |
| Estonians | 7.2 /100 | #226 | Tragic 20.7% |
| Immigrants | Sweden | 6.8 /100 | #227 | Tragic 20.7% |
| Ghanaians | 6.5 /100 | #228 | Tragic 20.8% |
| Australians | 6.1 /100 | #229 | Tragic 20.8% |
| Whites/Caucasians | 6.1 /100 | #230 | Tragic 20.8% |
| Immigrants | St. Vincent and the Grenadines | 6.0 /100 | #231 | Tragic 20.8% |
| Finns | 6.0 /100 | #232 | Tragic 20.8% |
| Immigrants | Denmark | 5.8 /100 | #233 | Tragic 20.8% |
Demographics Similar to Immigrants from Saudi Arabia by Female Poverty Among 18-24 Year Olds
In terms of female poverty among 18-24 year olds, the demographic groups most similar to Immigrants from Saudi Arabia are Yakama (25.3%, a difference of 0.25%), German Russian (25.2%, a difference of 0.43%), Arapaho (25.2%, a difference of 0.46%), Ute (25.4%, a difference of 0.48%), and Somali (25.1%, a difference of 0.53%).
| Demographics | Rating | Rank | Female Poverty Among 18-24 Year Olds |
| Chickasaw | 0.0 /100 | #318 | Tragic 24.5% |
| Dutch West Indians | 0.0 /100 | #319 | Tragic 24.5% |
| Immigrants | Congo | 0.0 /100 | #320 | Tragic 24.6% |
| Immigrants | Zaire | 0.0 /100 | #321 | Tragic 25.1% |
| Somalis | 0.0 /100 | #322 | Tragic 25.1% |
| Arapaho | 0.0 /100 | #323 | Tragic 25.2% |
| German Russians | 0.0 /100 | #324 | Tragic 25.2% |
| Immigrants | Saudi Arabia | 0.0 /100 | #325 | Tragic 25.3% |
| Yakama | 0.0 /100 | #326 | Tragic 25.3% |
| Ute | 0.0 /100 | #327 | Tragic 25.4% |
| Natives/Alaskans | 0.0 /100 | #328 | Tragic 25.4% |
| Cajuns | 0.0 /100 | #329 | Tragic 25.7% |
| Immigrants | Somalia | 0.0 /100 | #330 | Tragic 25.7% |
| Chippewa | 0.0 /100 | #331 | Tragic 25.9% |
| Houma | 0.0 /100 | #332 | Tragic 26.2% |