English vs Tohono O'odham 4th Grade
COMPARE
English
Tohono O'odham
4th Grade
4th Grade Comparison
English
Tohono O'odham
98.4%
4TH GRADE
100.0/ 100
METRIC RATING
11th/ 347
METRIC RANK
97.3%
4TH GRADE
8.4/ 100
METRIC RATING
212th/ 347
METRIC RANK
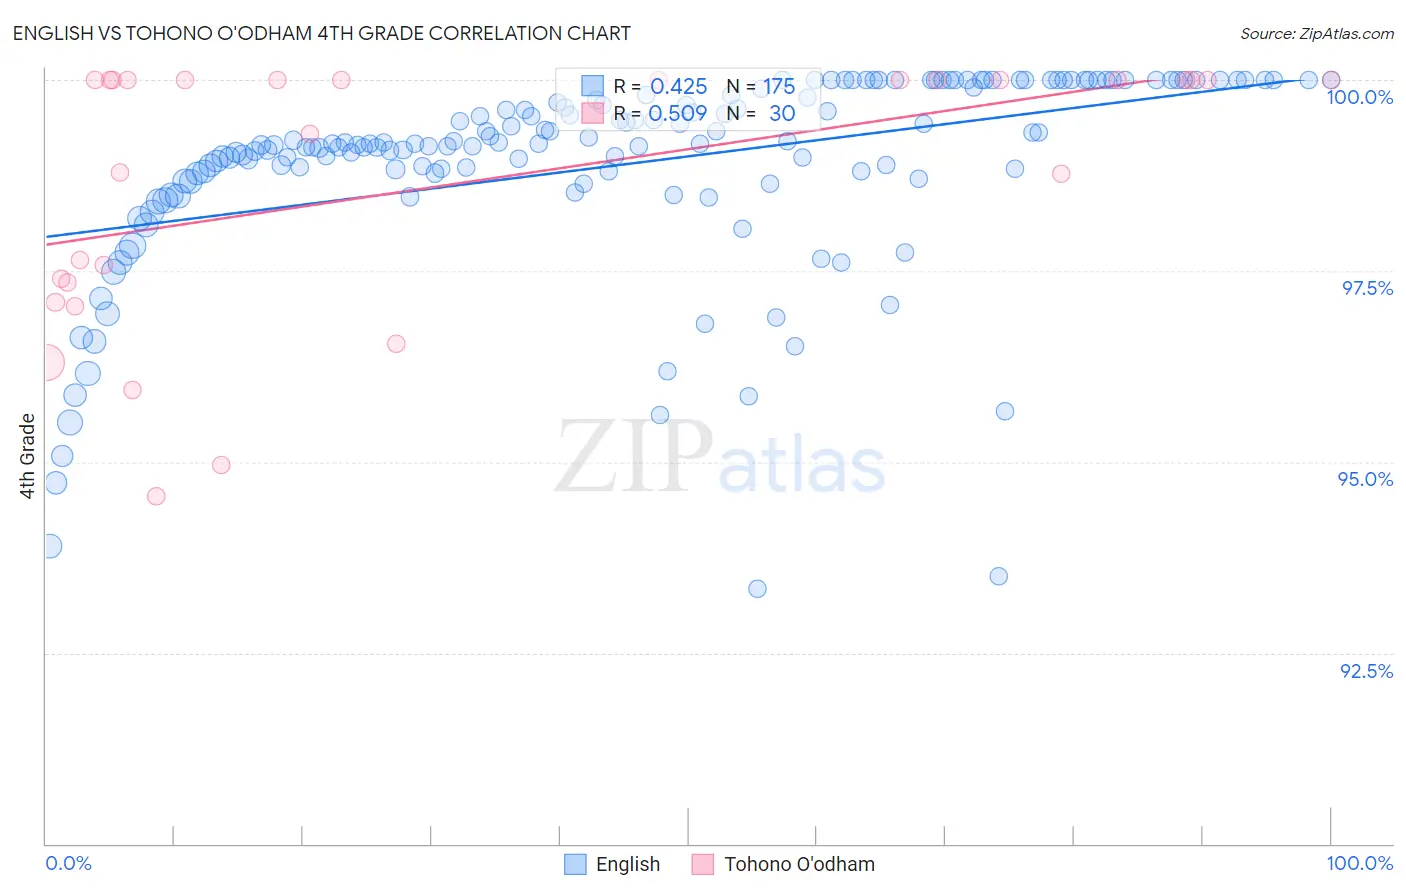
English vs Tohono O'odham 4th Grade Correlation Chart
The statistical analysis conducted on geographies consisting of 579,981,272 people shows a moderate positive correlation between the proportion of English and percentage of population with at least 4th grade education in the United States with a correlation coefficient (R) of 0.425 and weighted average of 98.4%. Similarly, the statistical analysis conducted on geographies consisting of 58,723,100 people shows a substantial positive correlation between the proportion of Tohono O'odham and percentage of population with at least 4th grade education in the United States with a correlation coefficient (R) of 0.509 and weighted average of 97.3%, a difference of 1.1%.
4th Grade Correlation Summary
| Measurement | English | Tohono O'odham |
| Minimum | 93.3% | 94.6% |
| Maximum | 100.0% | 100.0% |
| Range | 6.7% | 5.4% |
| Mean | 98.9% | 98.6% |
| Median | 99.2% | 100.0% |
| Interquartile 25% (IQ1) | 98.7% | 97.3% |
| Interquartile 75% (IQ3) | 99.9% | 100.0% |
| Interquartile Range (IQR) | 1.2% | 2.7% |
| Standard Deviation (Sample) | 1.3% | 1.7% |
| Standard Deviation (Population) | 1.3% | 1.7% |
Similar Demographics by 4th Grade
Demographics Similar to English by 4th Grade
In terms of 4th grade, the demographic groups most similar to English are Tlingit-Haida (98.4%, a difference of 0.0%), Swedish (98.4%, a difference of 0.0%), Alaskan Athabascan (98.4%, a difference of 0.010%), Carpatho Rusyn (98.4%, a difference of 0.010%), and Slovene (98.4%, a difference of 0.030%).
| Demographics | Rating | Rank | 4th Grade |
| Inupiat | 100.0 /100 | #4 | Exceptional 98.6% |
| Yup'ik | 100.0 /100 | #5 | Exceptional 98.5% |
| Norwegians | 100.0 /100 | #6 | Exceptional 98.5% |
| Slovaks | 100.0 /100 | #7 | Exceptional 98.5% |
| Germans | 100.0 /100 | #8 | Exceptional 98.5% |
| Slovenes | 100.0 /100 | #9 | Exceptional 98.4% |
| Alaskan Athabascans | 100.0 /100 | #10 | Exceptional 98.4% |
| English | 100.0 /100 | #11 | Exceptional 98.4% |
| Tlingit-Haida | 100.0 /100 | #12 | Exceptional 98.4% |
| Swedes | 100.0 /100 | #13 | Exceptional 98.4% |
| Carpatho Rusyns | 100.0 /100 | #14 | Exceptional 98.4% |
| Dutch | 100.0 /100 | #15 | Exceptional 98.4% |
| Scottish | 100.0 /100 | #16 | Exceptional 98.4% |
| Pennsylvania Germans | 100.0 /100 | #17 | Exceptional 98.4% |
| Poles | 100.0 /100 | #18 | Exceptional 98.4% |
Demographics Similar to Tohono O'odham by 4th Grade
In terms of 4th grade, the demographic groups most similar to Tohono O'odham are Costa Rican (97.3%, a difference of 0.0%), Laotian (97.3%, a difference of 0.010%), Immigrants from Oceania (97.3%, a difference of 0.010%), Sudanese (97.3%, a difference of 0.010%), and Immigrants from Nepal (97.3%, a difference of 0.010%).
| Demographics | Rating | Rank | 4th Grade |
| Paiute | 13.2 /100 | #205 | Poor 97.3% |
| Immigrants | Zaire | 12.8 /100 | #206 | Poor 97.3% |
| Moroccans | 11.3 /100 | #207 | Poor 97.3% |
| Immigrants | Bahamas | 10.8 /100 | #208 | Poor 97.3% |
| Laotians | 9.3 /100 | #209 | Tragic 97.3% |
| Immigrants | Oceania | 9.1 /100 | #210 | Tragic 97.3% |
| Sudanese | 9.0 /100 | #211 | Tragic 97.3% |
| Tohono O'odham | 8.4 /100 | #212 | Tragic 97.3% |
| Costa Ricans | 8.3 /100 | #213 | Tragic 97.3% |
| Immigrants | Nepal | 7.7 /100 | #214 | Tragic 97.3% |
| Immigrants | Morocco | 7.1 /100 | #215 | Tragic 97.3% |
| Samoans | 6.8 /100 | #216 | Tragic 97.3% |
| Sierra Leoneans | 6.5 /100 | #217 | Tragic 97.3% |
| Iraqis | 6.3 /100 | #218 | Tragic 97.3% |
| Tongans | 5.8 /100 | #219 | Tragic 97.3% |