Egyptian vs Immigrants from Congo Family Households

COMPARE

Egyptian
Race
Ancestry
AfghanAfricanAlaska NativeAlaskan AthabascanAlbanianAleutAlsatianAmericanApacheArabArapahoArgentineanArmenianAssyrian/Chaldean/SyriacAustralianAustrianBahamianBangladeshiBarbadianBasqueBelgianBelizeanBermudanBhutaneseBlackfeetBolivianBrazilianBritishBritish West IndianBulgarianBurmeseCajunCambodianCanadianCape VerdeanCarpatho RusynCelticCentral AmericanCentral American IndianCherokeeCheyenneChickasawChileanChineseChippewaChoctawColombianColvilleComancheCosta RicanCreeCreekCroatianCrowCubanCypriotCzechCzechoslovakianDanishDelawareDominicanDutchDutch West IndianEastern EuropeanEcuadorianEgyptianEnglishEstonianEthiopianEuropeanFijianFilipinoFinnishFrenchFrench American IndianFrench CanadianGermanGerman RussianGhanaianGreekGuamanian/ChamorroGuatemalanGuyaneseHaitianHmongHonduranHopiHoumaHungarianIcelanderIndian (Asian)IndonesianInupiatIranianIraqiIrishIroquoisIsraeliItalianJamaicanJapaneseJordanianKenyanKiowaKoreanLaotianLatvianLebaneseLiberianLithuanianLumbeeLuxembourgerMacedonianMalaysianMalteseMarshalleseMenomineeMexicanMexican American IndianMongolianMoroccanNative HawaiianNavajoNepaleseNew ZealanderNicaraguanNigerianNorthern EuropeanNorwegianOkinawanOsageOttawaPaiutePakistaniPalestinianPanamanianParaguayanPennsylvania GermanPeruvianPimaPolishPortuguesePotawatomiPuebloPuerto RicanPuget Sound SalishRomanianRussianSalvadoranSamoanScandinavianScotch-IrishScottishSeminoleSenegaleseSerbianShoshoneSierra LeoneanSiouxSlavicSlovakSloveneSomaliSouth AfricanSouth AmericanSouth American IndianSoviet UnionSpaniardSpanishSpanish AmericanSpanish American IndianSri LankanSubsaharan AfricanSudaneseSwedishSwissSyrianTaiwaneseThaiTlingit-HaidaTohono O'OdhamTonganTrinidadian and TobagonianTsimshianTurkishU.S. Virgin IslanderUgandanUkrainianUruguayanUteVenezuelanVietnameseWelshWest IndianYakamaYaquiYugoslavianYumanYup'ikZimbabwean
Immigration
NonimmigrantsImmigrantsAfghanistanAfricaAlbaniaArgentinaArmeniaAsiaAustraliaAustriaBahamasBangladeshBarbadosBelarusBelgiumBelizeBoliviaBosnia and HerzegovinaBrazilBulgariaBurma/MyanmarCabo VerdeCambodiaCameroonCanadaCaribbeanCentral AmericaChileChinaColombiaCosta RicaCroatiaCubaCzechoslovakiaDenmarkDominicaDominican RepublicEastern AfricaEastern AsiaEastern EuropeEcuadorEgyptEl SalvadorEnglandEritreaEthiopiaEuropeFijiFranceGermanyGhanaGreeceGrenadaGuatemalaGuyanaHaitiHondurasHong KongHungaryIndiaIndonesiaIranIraqIrelandIsraelItalyJamaicaJapanJordanKazakhstanKenyaKoreaKuwaitLaosLatin AmericaLatviaLebanonLiberiaLithuaniaMalaysiaMexicoMicronesiaMiddle AfricaMoldovaMoroccoNepalNetherlandsNicaraguaNigeriaNorth AmericaNorth MacedoniaNorthern AfricaNorthern EuropeNorwayOceaniaPakistanPanamaPeruPhilippinesPolandPortugalRomaniaRussiaSaudi ArabiaScotlandSenegalSerbiaSierra LeoneSingaporeSomaliaSouth AfricaSouth AmericaSouth Central AsiaSouth Eastern AsiaSouthern EuropeSpainSri LankaSt. Vincent and the GrenadinesSudanSwedenSwitzerlandSyriaTaiwanThailandTrinidad and TobagoTurkeyUgandaUkraineUruguayUzbekistanVenezuelaVietnamWest IndiesWestern AfricaWestern AsiaWestern EuropeYemenZaireZimbabweAzores
Immigrants from Congo
Race
Ancestry
AfghanAfricanAlaska NativeAlaskan AthabascanAlbanianAleutAlsatianAmericanApacheArabArapahoArgentineanArmenianAssyrian/Chaldean/SyriacAustralianAustrianBahamianBangladeshiBarbadianBasqueBelgianBelizeanBermudanBhutaneseBlackfeetBolivianBrazilianBritishBritish West IndianBulgarianBurmeseCajunCambodianCanadianCape VerdeanCarpatho RusynCelticCentral AmericanCentral American IndianCherokeeCheyenneChickasawChileanChineseChippewaChoctawColombianColvilleComancheCosta RicanCreeCreekCroatianCrowCubanCypriotCzechCzechoslovakianDanishDelawareDominicanDutchDutch West IndianEastern EuropeanEcuadorianEnglishEstonianEthiopianEuropeanFijianFilipinoFinnishFrenchFrench American IndianFrench CanadianGermanGerman RussianGhanaianGreekGuamanian/ChamorroGuatemalanGuyaneseHaitianHmongHonduranHopiHoumaHungarianIcelanderIndian (Asian)IndonesianInupiatIranianIraqiIrishIroquoisIsraeliItalianJamaicanJapaneseJordanianKenyanKiowaKoreanLaotianLatvianLebaneseLiberianLithuanianLumbeeLuxembourgerMacedonianMalaysianMalteseMarshalleseMenomineeMexicanMexican American IndianMongolianMoroccanNative HawaiianNavajoNepaleseNew ZealanderNicaraguanNigerianNorthern EuropeanNorwegianOkinawanOsageOttawaPaiutePakistaniPalestinianPanamanianParaguayanPennsylvania GermanPeruvianPimaPolishPortuguesePotawatomiPuebloPuerto RicanPuget Sound SalishRomanianRussianSalvadoranSamoanScandinavianScotch-IrishScottishSeminoleSenegaleseSerbianShoshoneSierra LeoneanSiouxSlavicSlovakSloveneSomaliSouth AfricanSouth AmericanSouth American IndianSoviet UnionSpaniardSpanishSpanish AmericanSpanish American IndianSri LankanSubsaharan AfricanSudaneseSwedishSwissSyrianTaiwaneseThaiTlingit-HaidaTohono O'OdhamTonganTrinidadian and TobagonianTsimshianTurkishU.S. Virgin IslanderUgandanUkrainianUruguayanUteVenezuelanVietnameseWelshWest IndianYakamaYaquiYugoslavianYumanYup'ikZimbabwean
Immigration
NonimmigrantsImmigrantsAfghanistanAfricaAlbaniaArgentinaArmeniaAsiaAustraliaAustriaBahamasBangladeshBarbadosBelarusBelgiumBelizeBoliviaBosnia and HerzegovinaBrazilBulgariaBurma/MyanmarCabo VerdeCambodiaCameroonCanadaCaribbeanCentral AmericaChileChinaColombiaCongoCosta RicaCroatiaCubaCzechoslovakiaDenmarkDominicaDominican RepublicEastern AfricaEastern AsiaEastern EuropeEcuadorEgyptEl SalvadorEnglandEritreaEthiopiaEuropeFijiFranceGermanyGhanaGreeceGrenadaGuatemalaGuyanaHaitiHondurasHong KongHungaryIndiaIndonesiaIranIraqIrelandIsraelItalyJamaicaJapanJordanKazakhstanKenyaKoreaKuwaitLaosLatin AmericaLatviaLebanonLiberiaLithuaniaMalaysiaMexicoMicronesiaMiddle AfricaMoldovaMoroccoNepalNetherlandsNicaraguaNigeriaNorth AmericaNorth MacedoniaNorthern AfricaNorthern EuropeNorwayOceaniaPakistanPanamaPeruPhilippinesPolandPortugalRomaniaRussiaSaudi ArabiaScotlandSenegalSerbiaSierra LeoneSingaporeSomaliaSouth AfricaSouth AmericaSouth Central AsiaSouth Eastern AsiaSouthern EuropeSpainSri LankaSt. Vincent and the GrenadinesSudanSwedenSwitzerlandSyriaTaiwanThailandTrinidad and TobagoTurkeyUgandaUkraineUruguayUzbekistanVenezuelaVietnamWest IndiesWestern AfricaWestern AsiaWestern EuropeYemenZaireZimbabweAzores
Family Households
Income
Poverty
Unemployment
Labor Participation
Family Structure
Vehicle Availability
Education Level
Disability

Family Households Comparison

Egyptians

Immigrants from Congo

Exceptional
Tragic
65.4%
FAMILY HOUSEHOLDS
99.4/ 100
METRIC RATING
86th/ 347
METRIC RANK
59.2%
FAMILY HOUSEHOLDS
0.0/ 100
METRIC RATING
344th/ 347
METRIC RANK

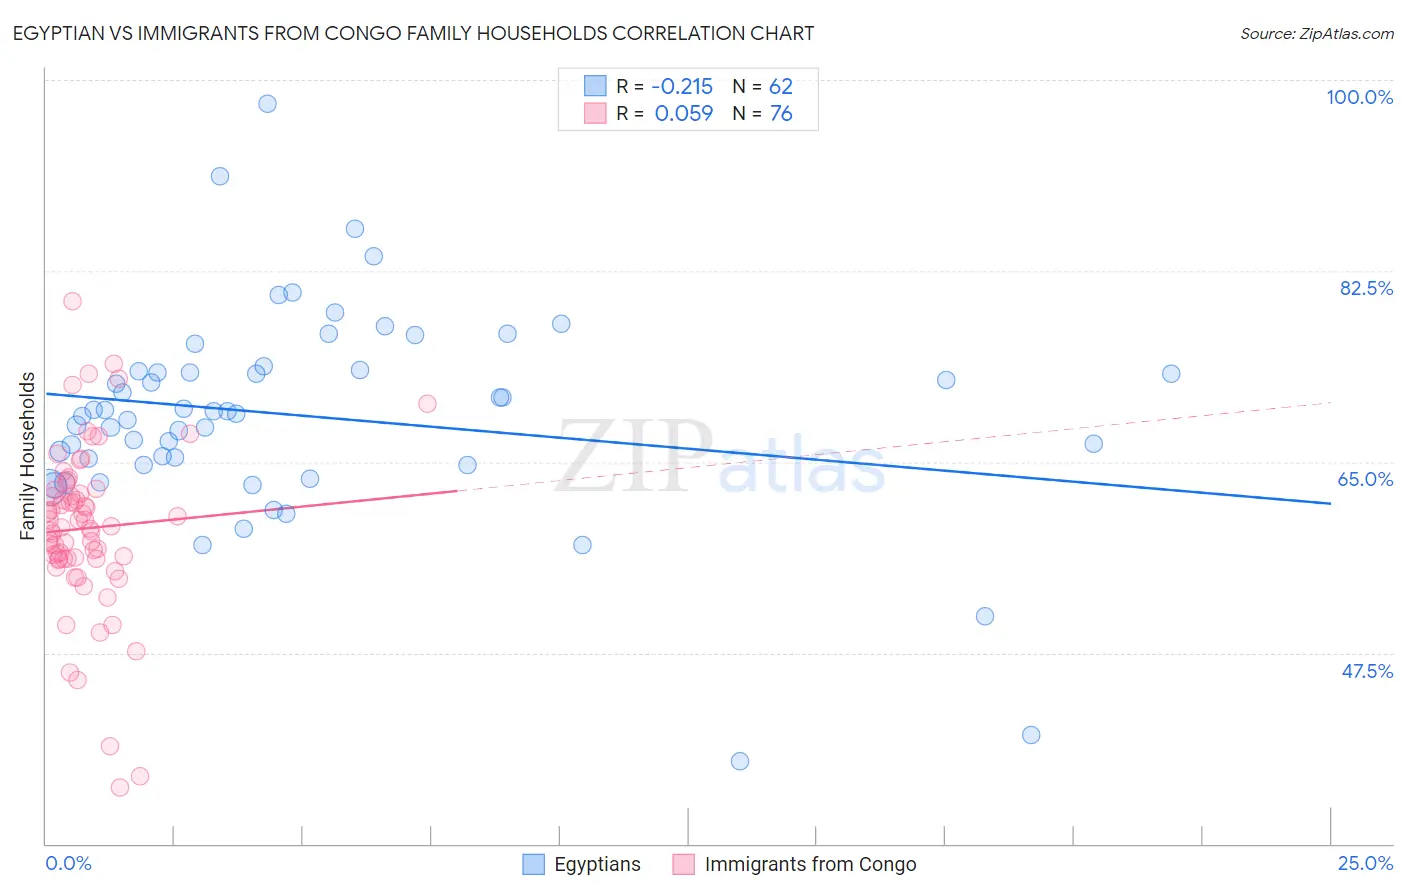
Egyptian vs Immigrants from Congo Family Households Correlation Chart

The statistical analysis conducted on geographies consisting of 276,780,466 people shows a weak negative correlation between the proportion of Egyptians and percentage of family households in the United States with a correlation coefficient (R) of -0.215 and weighted average of 65.4%. Similarly, the statistical analysis conducted on geographies consisting of 92,089,117 people shows a slight positive correlation between the proportion of Immigrants from Congo and percentage of family households in the United States with a correlation coefficient (R) of 0.059 and weighted average of 59.2%, a difference of 10.4%.
Egyptian vs Immigrants from Congo Family Households

Family Households Correlation Summary

MeasurementEgyptianImmigrants from Congo
Minimum37.6%35.2%
Maximum97.8%79.8%
Range60.2%44.6%
Mean69.2%58.9%
Median69.5%59.0%
Interquartile 25% (IQ1)64.8%56.1%
Interquartile 75% (IQ3)73.3%62.2%
Interquartile Range (IQR)8.6%6.1%
Standard Deviation (Sample)9.7%7.7%
Standard Deviation (Population)9.6%7.6%

Similar Demographics by Family Households

Demographics Similar to Egyptians by Family Households

In terms of family households, the demographic groups most similar to Egyptians are Immigrants from Cambodia (65.4%, a difference of 0.050%), Immigrants from Egypt (65.3%, a difference of 0.090%), Immigrants from Haiti (65.3%, a difference of 0.12%), Immigrants from Caribbean (65.3%, a difference of 0.13%), and Immigrants from Laos (65.3%, a difference of 0.14%).
DemographicsRating | RankFamily Households
Immigrants | Costa Rica
99.8
/100
|
#79
Exceptional
65.6%
Puget Sound Salish
99.8
/100
|
#80
Exceptional
65.6%
Jordanians
99.7
/100
|
#81
Exceptional
65.5%
Immigrants | Lebanon
99.7
/100
|
#82
Exceptional
65.5%
Immigrants | Guyana
99.6
/100
|
#83
Exceptional
65.5%
Americans
99.6
/100
|
#84
Exceptional
65.5%
Immigrants | Cambodia
99.5
/100
|
#85
Exceptional
65.4%
Egyptians
99.4
/100
|
#86
Exceptional
65.4%
Immigrants | Egypt
99.2
/100
|
#87
Exceptional
65.3%
Immigrants | Haiti
99.1
/100
|
#88
Exceptional
65.3%
Immigrants | Caribbean
99.1
/100
|
#89
Exceptional
65.3%
Immigrants | Laos
99.1
/100
|
#90
Exceptional
65.3%
Crow
98.9
/100
|
#91
Exceptional
65.3%
Hopi
98.8
/100
|
#92
Exceptional
65.3%
Guyanese
98.8
/100
|
#93
Exceptional
65.3%

Demographics Similar to Immigrants from Congo by Family Households

In terms of family households, the demographic groups most similar to Immigrants from Congo are Immigrants from Zaire (59.2%, a difference of 0.14%), Senegalese (59.8%, a difference of 0.97%), Sudanese (60.0%, a difference of 1.3%), Immigrants from Senegal (60.1%, a difference of 1.5%), and Immigrants from Sudan (60.2%, a difference of 1.5%).
DemographicsRating | RankFamily Households
Immigrants | Ethiopia
0.0
/100
|
#333
Tragic
61.2%
Immigrants | Eastern Africa
0.0
/100
|
#334
Tragic
61.1%
Carpatho Rusyns
0.0
/100
|
#335
Tragic
61.1%
German Russians
0.0
/100
|
#336
Tragic
60.9%
Soviet Union
0.0
/100
|
#337
Tragic
60.9%
Immigrants | Eritrea
0.0
/100
|
#338
Tragic
60.8%
Immigrants | Saudi Arabia
0.0
/100
|
#339
Tragic
60.7%
Immigrants | Sudan
0.0
/100
|
#340
Tragic
60.2%
Immigrants | Senegal
0.0
/100
|
#341
Tragic
60.1%
Sudanese
0.0
/100
|
#342
Tragic
60.0%
Senegalese
0.0
/100
|
#343
Tragic
59.8%
Immigrants | Congo
0.0
/100
|
#344
Tragic
59.2%
Immigrants | Zaire
0.0
/100
|
#345
Tragic
59.2%
Somalis
0.0
/100
|
#346
Tragic
57.6%
Immigrants | Somalia
0.0
/100
|
#347
Tragic
56.7%